Chevron 2007 Annual Report Download - page 67
Download and view the complete annual report
Please find page 67 of the 2007 Chevron annual report below. You can navigate through the pages in the report by either clicking on the pages listed below, or by using the keyword search tool below to find specific information within the annual report.-
 1
1 -
2
-
3
-
4
-
5
-
6
-
7
-
8
-
9
-
10
-
11
-
12
-
13
-
14
-
15
-
16
-
17
-
18
-
19
-
20
-
21
-
22
-
23
-
24
-
25
-
26
-
27
-
28
-
29
-
30
-
31
-
32
-
33
-
34
-
35
-
36
-
37
-
38
-
39
-
40
-
41
-
42
-
43
-
44
-
45
-
46
-
47
-
48
-
49
-
50
-
51
-
52
-
53
-
54
-
55
-
56
-
 57
57 -
 58
58 -
 59
59 -
 60
60 -
 61
61 -
 62
62 -
 63
63 -
 64
64 -
 65
65 -
 66
66 -
 67
67 -
 68
68 -
 69
69 -
 70
70 -
 71
71 -
 72
72 -
 73
73 -
 74
74 -
 75
75 -
 76
76 -
 77
77 -
78
-
79
-
80
-
81
-
82
-
83
-
84
-
85
-
86
-
87
-
88
-
89
-
90
-
91
-
92
-
93
-
94
-
95
-
96
-
97
-
98
-
99
-
100
-
101
-
102
-
103
-
104
-
105
-
106
-
107
-
108
 |
 |

65
cash management and debt financing activities, corporate
administrative functions, insurance operations, real estate
activities, alternative fuels, and technology companies.
The company’s primary country of operation is the
United States of America, its country of domicile. Other
components of the company’s operations are reported as
“International” (outside the United States).
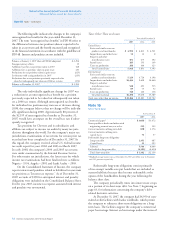
Segment Earnings The company evaluates the performance
of its operating segments on an after-tax basis, without con-
sidering the effects of debt financing interest expense or
investment interest income, both of which are managed by the
company on a worldwide basis. Corporate administrative
costs and assets are not allocated to the operating segments.
However, operating segments are billed for the direct use of
corporate services. Nonbillable costs remain at the corporate
level in “All Other.” After-tax segment income by major
operating area is presented in the following table:
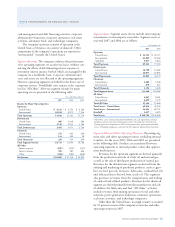
Segment Assets Segment assets do not include intercompany
investments or intercompany receivables. Segment assets at
year-end 2007 and 2006 are as follows:
At December 31
2007 2006
Upstream
United States $ 23,535 $ 20,727
International 61,049 51,844
Goodwill 4,637 4,623
Total Upstream 89,221 77,194
Downstream
United States 16,790 13,482
International 26,075 22,892
Total Downstream 42,865 36,374
Chemicals
United States 2,484 2,568
International 870 832
Total Chemicals 3,354 3,400
Total Segment Assets 135,440 116,968
All Other*
United States 6,847 8,481
International 6,499 7,179
Total All Other 13,346 15,660
Total Assets – United States 49,656 45,258
Total Assets – International 94,493 82,747
Goodwill 4,637 4,623
Total Assets $ 148,786 $ 132,628
* “All Other” assets consist primarily of worldwide cash, cash equivalents and mar-
ketable securities, real estate, information systems, the company’s investment in
Dynegy prior to its disposition in 2007, mining operations, power generation busi-
nesses, technology companies, and assets of the corporate administrative functions.
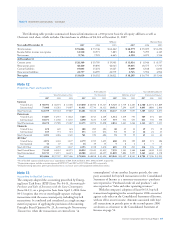
Segment Sales and Other Operating Revenues Operating seg-
ment sales and other operating revenues, including internal
transfers, for the years 2007, 2006 and 2005 are presented
in the following table. Products are transferred between
operating segments at internal product values that approxi-
mate market prices.
Revenues for the upstream segment are derived primarily
from the production and sale of crude oil and natural gas,
as well as the sale of third-party production of natural gas.
Revenues for the downstream segment are derived from the
refining and marketing of petroleum products, such as gaso-
line, jet fuel, gas oils, kerosene, lubricants, residual fuel oils
and other products derived from crude oil. This segment
also generates revenues from the transportation and trading
of crude oil and refined products. Revenues for the chemicals
segment are derived primarily from the manufacture and sale
of additives for lubricants and fuel. “All Other” activities
include revenues from mining operations of coal and other
minerals, power generation businesses, insurance operations,
real estate activities, and technology companies.
Other than the United States, no single country accounted
for 10 percent or more of the company’s total sales and other
operating revenues in 2007.
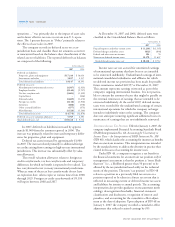
Year ended December 31
2007 2006 2005
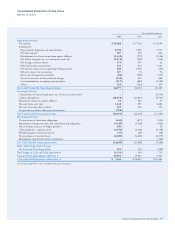
Income by Major Operating Area
Upstream
United States $ 4,532 $ 4,270 $ 4,168
International 10,284 8,872 7,556
Total Upstream 14,816 13,142 11,724
Downstream
United States 966 1,938 980
International 2,536 2,035 1,786
Total Downstream 3,502 3,973 2,766
Chemicals
United States 253 430 240
International 143 109 58
Total Chemicals 396 539 298
Total Segment Income 18,714 17,654 14,788
All Other
Interest expense (107) (312) (337)
Interest income 385 380 266
Other (304) (584) (618)
Net Income $ 18,688 $ 17,138 $ 14,099