Chevron 2007 Annual Report Download - page 36
Download and view the complete annual report
Please find page 36 of the 2007 Chevron annual report below. You can navigate through the pages in the report by either clicking on the pages listed below, or by using the keyword search tool below to find specific information within the annual report.-
 1
1 -
2
-
3
-
4
-
5
-
6
-
7
-
8
-
9
-
10
-
11
-
12
-
13
-
14
-
15
-
16
-
17
-
18
-
19
-
20
-
21
-
22
-
23
-
24
-
25
-
 26
26 -
 27
27 -
 28
28 -
 29
29 -
 30
30 -
 31
31 -
 32
32 -
 33
33 -
 34
34 -
 35
35 -
 36
36 -
 37
37 -
 38
38 -
 39
39 -
 40
40 -
 41
41 -
 42
42 -
 43
43 -
 44
44 -
 45
45 -
 46
46 -
47
-
48
-
49
-
50
-
51
-
52
-
53
-
54
-
55
-
56
-
57
-
58
-
59
-
60
-
61
-
62
-
63
-
64
-
65
-
66
-
67
-
68
-
69
-
70
-
71
-
72
-
73
-
74
-
75
-
76
-
77
-
78
-
79
-
80
-
81
-
82
-
83
-
84
-
85
-
86
-
87
-
88
-
89
-
90
-
91
-
92
-
93
-
94
-
95
-
96
-
97
-
98
-
99
-
100
-
101
-
102
-
103
-
104
-
105
-
106
-
107
-
108
 |
 |
34
South Korea Completed construction and commissioned
new facilities associated with a $1.5 billion upgrade at the 50
percent-owned GS Caltex Yeosu Refinery, enabling the refinery
to process heavier and higher-sulfur crude oils and increase the
production of gasoline, diesel and other light products.
United States Approved plans at the company’s refinery
in Pascagoula, Mississippi, for the construction of a Continu-
ous Catalyst Regeneration unit, which is expected to increase
gasoline production by 10 percent, or 600,000 gallons per
day, by mid-2010. At the refinery in El Segundo, California,
modifications were completed to enable the processing of
heavier crude oils into light transportation fuels and other
refined products.
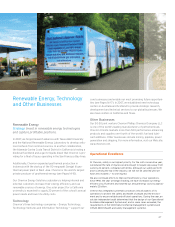
Other
Common Stock Dividends Increased the company’s quarterly
common stock dividend by 11.5 percent in April to $0.58 per
share, marking the 20th consecutive year the company has
increased its annual dividend payment.
Common Stock Repurchase Program Approved a program
in September to acquire up to $15 billion of the company’s
common stock over a period of up to three years, which fol-
lowed three stock repurchase programs of $5 billion each
that were completed in 2005, 2006 and September 2007.
Dynegy Sold the company’s common stock investment
in Dynegy Inc., resulting in a gain of $680 million.
Major Operating Areas The following section presents the
results of operations for the company’s business segments –
upstream, downstream and chemicals – as well as for “all
other,” which includes mining, power generation businesses,
the various companies and departments that are managed at
the corporate level, and the company’s investment in Dynegy
prior to its sale in May 2007. Income is also presented for the
U.S. and international geographic areas of the upstream and
downstream business segments. (Refer to Note 8, beginning
on page 64, for a discussion of the company’s “reportable
segments,” as defined in FASB No. 131, Disclosures About
Segments of an Enterprise and Related Information.) This
section should also be read in conjunction with the discus-
sion in “Business Environment and Outlook” on pages 30
through 33.
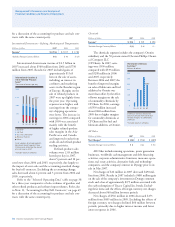
U.S. Upstream – Exploration and Production
Millions of dollars 2007 2006 2005
Income $ 4,532 $ 4,270 $ 4,168
U.S. upstream income of $4.5 billion in 2007 increased
approximately $260 million from 2006. Results in 2007
benefited approximately $700 million from higher prices for
crude oil and natural gas liquids. This benefit to income was
partially offset by the effects of a decline in oil-equivalent
production and an increase in depreciation, operating and
exploration expenses.
Income of $4.3 billion in 2006 increased approximately
$100 million from 2005. Earnings in 2006 benefited about
$850 million from higher average prices on oil-equivalent
production and the effect of seven additional months of
production from the Unocal properties that were acquired
in August 2005. Substantially offsetting these benefits were
increases in operating, exploration and depreciation expenses.
Included in the operating expense increases were costs associ-
ated with the carryover effects of hurricanes in the Gulf of
Mexico in 2005.
The company’s average realization for crude oil and natu-
ral gas liquids in 2007 was $63.16 per barrel, compared with
$56.66 in 2006 and $46.97 in 2005. The average natural gas
realization was $6.12 per thousand cubic feet in 2007, com-
pared with $6.29 and $7.43 in 2006 and 2005, respectively.
Net oil-equivalent production in 2007 averaged
743,000 barrels per day, down 2.6 percent from 2006 and
up 2 percent from 2005, which included only five months of
production from the Unocal properties acquired in August
of that year. The net liquids component of oil-equivalent
production for 2007 averaged 460,000 barrels per day,
which was essentially flat compared with 2006, and an
increase of 1 percent from 2005. Net natural gas production
averaged 1.7 billion cubic feet per day in 2007, down 6 per-
cent from 2006 and up 4 percent from 2005.
Management’s Discussion and Analysis of
Financial Condition and Results of Operations
'
(,''
()''
0''
-''
*''
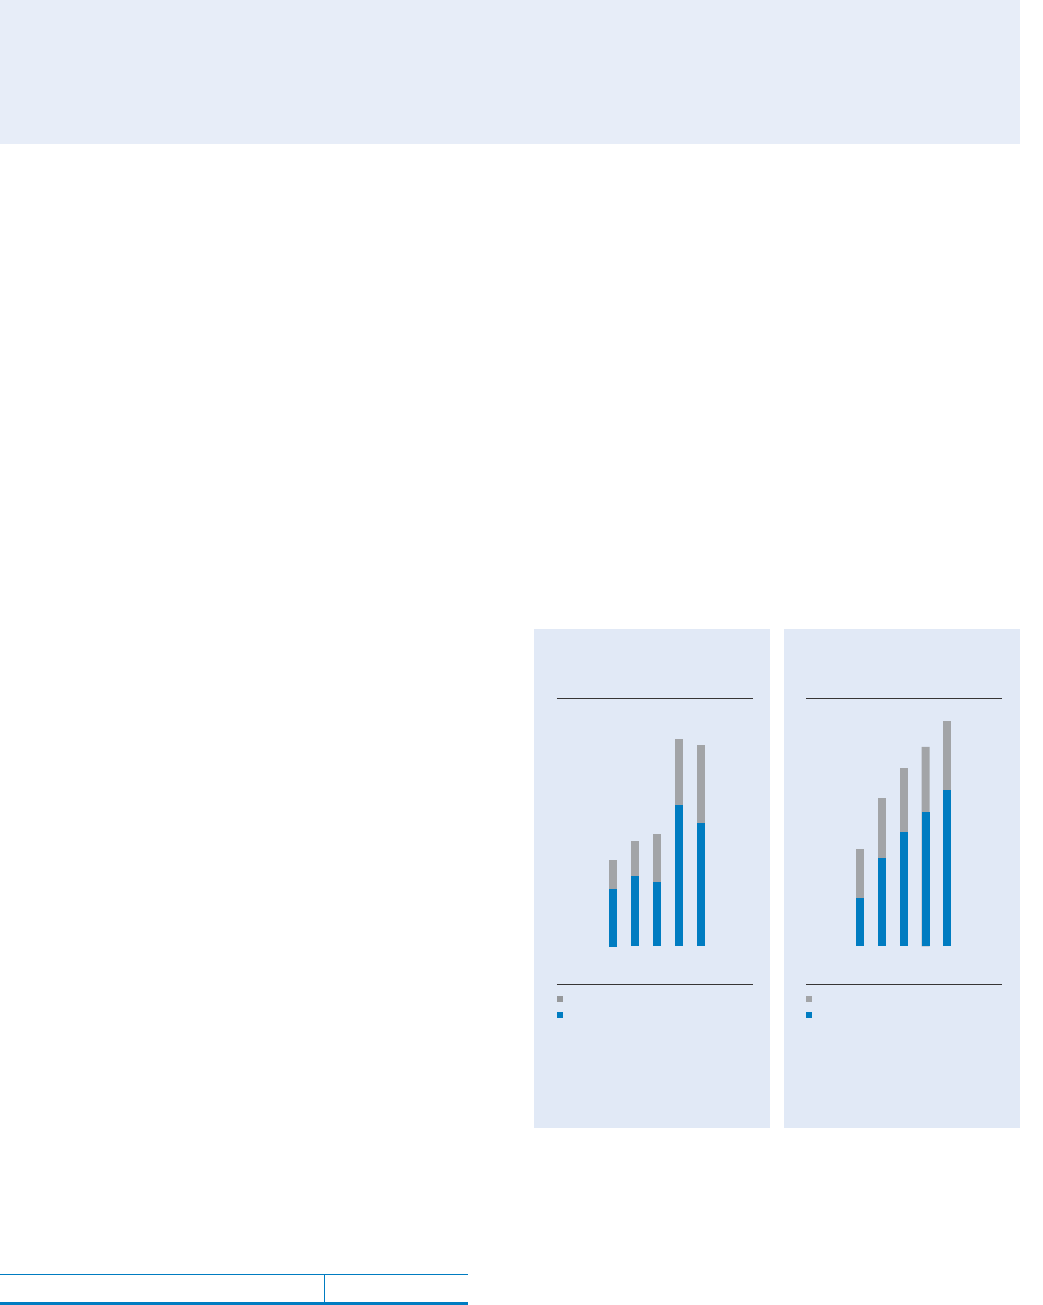
Exploration Expenses
016 – Exploration Expenses – v2
'+'* ', '- '.
(#*)*
'%'
(,%'
0%'
()%'
-%'
*%'
017 – orldwide Expl Prod
Earnings – v2
orldwide Exploration
Production Earnings
'+'* ', '- '.
(+%/