Chevron 2007 Annual Report Download - page 53
Download and view the complete annual report
Please find page 53 of the 2007 Chevron annual report below. You can navigate through the pages in the report by either clicking on the pages listed below, or by using the keyword search tool below to find specific information within the annual report.-
 1
1 -
2
-
3
-
4
-
5
-
6
-
7
-
8
-
9
-
10
-
11
-
12
-
13
-
14
-
15
-
16
-
17
-
18
-
19
-
20
-
21
-
22
-
23
-
24
-
25
-
26
-
27
-
28
-
29
-
30
-
31
-
32
-
33
-
34
-
35
-
36
-
37
-
38
-
39
-
40
-
41
-
42
-
 43
43 -
 44
44 -
 45
45 -
 46
46 -
 47
47 -
 48
48 -
 49
49 -
 50
50 -
 51
51 -
 52
52 -
 53
53 -
 54
54 -
 55
55 -
 56
56 -
 57
57 -
 58
58 -
 59
59 -
 60
60 -
 61
61 -
 62
62 -
 63
63 -
64
-
65
-
66
-
67
-
68
-
69
-
70
-
71
-
72
-
73
-
74
-
75
-
76
-
77
-
78
-
79
-
80
-
81
-
82
-
83
-
84
-
85
-
86
-
87
-
88
-
89
-
90
-
91
-
92
-
93
-
94
-
95
-
96
-
97
-
98
-
99
-
100
-
101
-
102
-
103
-
104
-
105
-
106
-
107
-
108
 |
 |

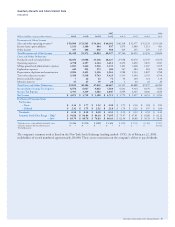
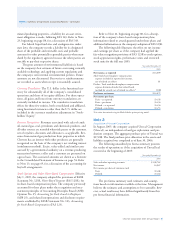
Quarterly Results and Stock Market Data
2007 2006
Millions of dollars, except per-share amounts 4th Q 3rd Q 2nd Q 1st Q 4th Q 3rd Q 2nd Q 1st Q
Revenues and Other Income
Sales and other operating revenues1,2 $ 59,900 $ 53,545 $ 54,344 $ 46,302 $ 46,238 $ 52,977 $ 52,153 $ 53,524
Income from equity affiliates 1,153 1,160 894 937 1,079 1,080 1,113 983
Other income 357 468 856 988 429 155 270 117
Total Revenues and Other Income 61,410 55,173 56,094 48,227 47,746 54,212 53,536 54,624
Costs and Other Deductions
Purchased crude oil and products2 38,056 33,988 33,138 28,127 27,658 32,076 32,747 35,670
Operating expenses 4,798 4,397 4,124 3,613 4,092 3,650 3,835 3,047
Selling, general and administrative expenses 1,833 1,446 1,516 1,131 1,203 1,428 1,207 1,255
Exploration expenses 449 295 273 306 547 284 265 268
Depreciation, depletion and amortization 2,094 2,495 2,156 1,963 1,988 1,923 1,807 1,788
Taxes other than on income1 5,560 5,538 5,743 5,425 5,533 5,403 5,153 4,794
Interest and debt expense 7 22 63 74 92 104 121 134
Minority interests 35 25 19 28 2 20 22 26
Total Costs and Other Deductions 52,832 48,206 47,032 40,667 41,115 44,888 45,157 46,982
Income Before Income Tax Expense 8,578 6,967 9,062 7,560 6,631 9,324 8,379 7,642
Income Tax Expense 3,703 3,249 3,682 2,845 2,859 4,307 4,026 3,646
Net Income $ 4,875 $ 3,718 $ 5,380 $ 4,715 $ 3,772 $ 5,017 $ 4,353 $ 3,996
Per-Share of Common Stock
Net Income
– Basic $ 2.34 $ 1.77 $ 2.52 $ 2.20 $ 1.75 $ 2.30 $ 1.98 $ 1.81
– Diluted $ 2.32 $ 1.75 $ 2.52 $ 2.18 $ 1.74 $ 2.29 $ 1.97 $ 1.80
Dividends $ 0.58 $ 0.58 $ 0.58 $ 0.52 $ 0.52 $ 0.52 $ 0.52 $ 0.45
Common Stock Price Range – High3 $ 94.86 $ 94.84 $ 84.24 $ 74.95 $ 75.97 $ 67.85 $ 62.88 $ 62.21
– Low3 $ 83.79 $ 80.76 $ 74.83 $ 66.43 $ 62.94 $ 60.88 $ 56.78 $ 54.08
1 Includes excise, value-added and similar taxes: $ 2,548 $ 2,550 $ 2,609 $ 2,414 $ 2,498 $ 2,522 $ 2,416 $ 2,115
2 Includes amounts for buy/sell contracts: $ – $ – $ – $ – $ – $ – $ – $ 6,725
3 End of day price.
The company’s common stock is listed on the New York Stock Exchange (trading symbol: CVX). As of February 22, 2008,
stockholders of record numbered approximately 214,000. There are no restrictions on the company’s ability to pay dividends.
51