Chevron 2007 Annual Report Download - page 68
Download and view the complete annual report
Please find page 68 of the 2007 Chevron annual report below. You can navigate through the pages in the report by either clicking on the pages listed below, or by using the keyword search tool below to find specific information within the annual report.-
 1
1 -
2
-
3
-
4
-
5
-
6
-
7
-
8
-
9
-
10
-
11
-
12
-
13
-
14
-
15
-
16
-
17
-
18
-
19
-
20
-
21
-
22
-
23
-
24
-
25
-
26
-
27
-
28
-
29
-
30
-
31
-
32
-
33
-
34
-
35
-
36
-
37
-
38
-
39
-
40
-
41
-
42
-
43
-
44
-
45
-
46
-
47
-
48
-
49
-
50
-
51
-
52
-
53
-
54
-
55
-
56
-
57
-
 58
58 -
 59
59 -
 60
60 -
 61
61 -
 62
62 -
 63
63 -
 64
64 -
 65
65 -
 66
66 -
 67
67 -
 68
68 -
 69
69 -
 70
70 -
 71
71 -
 72
72 -
 73
73 -
 74
74 -
 75
75 -
 76
76 -
 77
77 -
 78
78 -
79
-
80
-
81
-
82
-
83
-
84
-
85
-
86
-
87
-
88
-
89
-
90
-
91
-
92
-
93
-
94
-
95
-
96
-
97
-
98
-
99
-
100
-
101
-
102
-
103
-
104
-
105
-
106
-
107
-
108
 |
 |

66
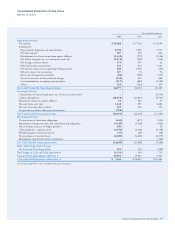
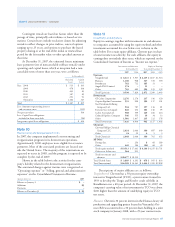
Year ended December 31
2007 2006 2005
Upstream
United States $ 18,736 $ 18,061 $ 16,044
Intersegment 11,625 10,069 8,651
Total United States 30,361 28,130 24,695
International 15,213 14,560 10,190
Intersegment 19,647 17,139 13,652
Total International 34,860 31,699 23,842
Total Upstream 65,221 59,829 48,537
Downstream
United States 70,535 69,367 73,721
Excise and similar taxes 4,990 4,829 4,521
Intersegment 491 533 535
Total United States 76,016 74,729 78,777
International 97,178 91,325 83,223
Excise and similar taxes 5,042 4,657 4,184
Intersegment 38 37 14
Total International 102,258 96,019 87,421
Total Downstream 178,274 170,748 166,198
Chemicals
United States 351 372 343
Excise and similar taxes 2 2 –
Intersegment 235 243 241
Total United States 588 617 584
International 1,143 959 760
Excise and similar taxes 86 63 14
Intersegment 142 160 131
Total International 1,371 1,182 905
Total Chemicals 1,959 1,799 1,489
All Other
United States 757 653 597
Intersegment 760 584 514
Total United States 1,517 1,237 1,111
International 58 44 44
Intersegment 31 23 26
Total International 89 67 70
Total All Other 1,606 1,304 1,181
Segment Sales and Other
Operating Revenues
United States 108,482 104,713 105,167
International 138,578 128,967 112,238
Total Segment Sales and Other
Operating Revenues 247,060 233,680 217,405
Elimination of intersegment sales (32,969) (28,788) (23,764)
Total Sales and Other
Operating Revenues* $ 214,091 $ 204,892 $ 193,641
* Includes buy/sell contracts of $6,725 in 2006 and $23,822 in 2005. Substantially all
of the amounts in each period relate to the downstream segment. Refer to Note 13,
on page 69, for a discussion of the company’s accounting for buy/sell contracts.
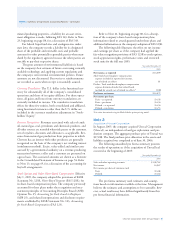
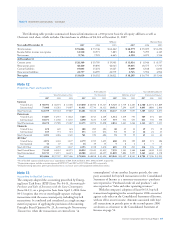
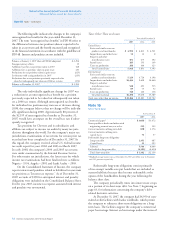
Segment Income Taxes Segment income tax expense for the
years 2007, 2006 and 2005 are as follows:
Year ended December 31
2007 2006 2005
Upstream
United States $ 2,541 $ 2,668 $ 2,330
International 11,307 10,987 8,440
Total Upstream 13,848 13,655 10,770
Downstream
United States 520 1,162 575
International 400 586 576
Total Downstream 920 1,748 1,151
Chemicals
United States 6 213 99
International 36 30 25
Total Chemicals 42 243 124
All Other (1,331) (808) (947)
Total Income Tax Expense $ 13,479 $ 14,838 $ 11,098
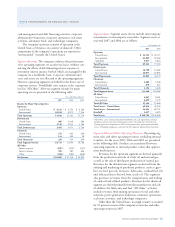
Other Segment Information Additional information for the
segmentation of major equity affiliates is contained in Note
11, beginning on page 67. Information related to properties,
plant and equipment by segment is contained in Note 12, on
page 69.
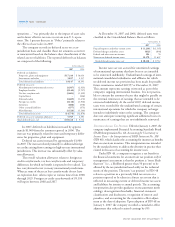
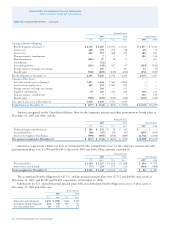
Certain noncancelable leases are classified as capital leases,
and the leased assets are included as part of “Properties, plant
and equipment, at cost.” Such leasing arrangements involve
tanker charters, crude oil production and processing equip-
ment, service stations, office buildings and other facilities.
Other leases are classified as operating leases and are not
capitalized. The payments on such leases are recorded as
expense. Details of the capitalized leased assets are as follows:
At December 31
2007 2006*
Upstream $ 482 $ 461
Downstream $ 551 $ 550
Chemical and all other 171 2
Total 1,204 1,013
Less: Accumulated amortization 628 548
Net capitalized leased assets $ 576 $ 465
* 2006 conformed to 2007 presentation.
Rental expenses incurred for operating leases during
2007, 2006 and 2005 were as follows:
Year ended December 31
2007 2006 2005
Minimum rentals $ 2,419 $ 2,326 $ 2,102
Contingent rentals 6 6 6
Total 2,425 2,332 2,108
Less: Sublease rental income 30 33 43
Net rental expense $ 2,395 $ 2,299 $ 2,065
Notes to the Consolidated Financial Statements