Chevron 2007 Annual Report Download - page 59
Download and view the complete annual report
Please find page 59 of the 2007 Chevron annual report below. You can navigate through the pages in the report by either clicking on the pages listed below, or by using the keyword search tool below to find specific information within the annual report.-
 1
1 -
2
-
3
-
4
-
5
-
6
-
7
-
8
-
9
-
10
-
11
-
12
-
13
-
14
-
15
-
16
-
17
-
18
-
19
-
20
-
21
-
22
-
23
-
24
-
25
-
26
-
27
-
28
-
29
-
30
-
31
-
32
-
33
-
34
-
35
-
36
-
37
-
38
-
39
-
40
-
41
-
42
-
43
-
44
-
45
-
46
-
47
-
48
-
 49
49 -
 50
50 -
 51
51 -
 52
52 -
 53
53 -
 54
54 -
 55
55 -
 56
56 -
 57
57 -
 58
58 -
 59
59 -
 60
60 -
 61
61 -
 62
62 -
 63
63 -
 64
64 -
 65
65 -
 66
66 -
 67
67 -
 68
68 -
 69
69 -
70
-
71
-
72
-
73
-
74
-
75
-
76
-
77
-
78
-
79
-
80
-
81
-
82
-
83
-
84
-
85
-
86
-
87
-
88
-
89
-
90
-
91
-
92
-
93
-
94
-
95
-
96
-
97
-
98
-
99
-
100
-
101
-
102
-
103
-
104
-
105
-
106
-
107
-
108
 |
 |

57 57
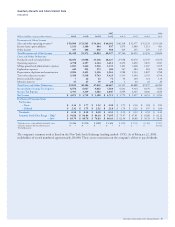
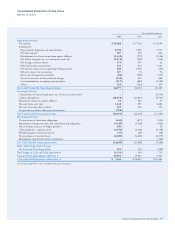
Year ended December 31
2007 2006 2005
Operating Activities
Net income $ 18,688 $ 17,138 $ 14,099
Adjustments
Depreciation, depletion and amortization 8,708 7,506 5,913
Dry hole expense 507 520 226
Distributions less than income from equity affiliates (1,439) (979) (1,304)
Net before-tax gains on asset retirements and sales (2,315) (229) (134)
Net foreign currency effects 378 259 62
Deferred income tax provision 261 614 1,393
Net decrease (increase) in operating working capital 685 1,044 (54)
Minority interest in net income 107 70 96
(Increase) in long-term receivables (82) (900) (191)
(Increase) decrease in other deferred charges (530) 232 668
Cash contributions to employee pension plans (317) (449) (1,022)
Other 326 (503) 353
Net Cash Provided by Operating Activities 24,977 24,323 20,105
Investing Activities
Cash portion of Unocal acquisition, net of Unocal cash received – – (5,934)
Capital expenditures (16,678) (13,813) (8,701)
Repayment of loans by equity affiliates 21 463 57
Proceeds from asset sales 3,338 989 2,681
Net sales of marketable securities 185 142 336
Net purchases of other short-term investments (799) – –
Net Cash Used for Investing Activities (13,933) (12,219) (11,561)
Financing Activities
Net payments of short-term obligations (345) (677) (109)
Repayments of long-term debt and other financing obligations (3,343) (2,224) (966)
Proceeds from issuances of long-term debt 650 – 20
Cash dividends – common stock (4,791) (4,396) (3,778)
Dividends paid to minority interests (77) (60) (98)
Net purchases of treasury shares (6,389) (4,491) (2,597)
Redemption of preferred stock of subsidiaries – – (140)
Net Cash Used for Financing Activities (14,295) (11,848) (7,668)
Effect of Exchange Rate Changes
On Cash and Cash Equivalents 120 194 (124)
Net Change in Cash and Cash Equivalents (3,131) 450 752
Cash and Cash Equivalents at January 1 10,493 10,043 9,291
Cash and Cash Equivalents at December 31 $ 7,362 $ 10,493 $ 10,043
See accompanying Notes to the Consolidated Financial Statements.
Consolidated Statement of Cash Flows