Chevron 2007 Annual Report Download - page 50
Download and view the complete annual report
Please find page 50 of the 2007 Chevron annual report below. You can navigate through the pages in the report by either clicking on the pages listed below, or by using the keyword search tool below to find specific information within the annual report.-
 1
1 -
2
-
3
-
4
-
5
-
6
-
7
-
8
-
9
-
10
-
11
-
12
-
13
-
14
-
15
-
16
-
17
-
18
-
19
-
20
-
21
-
22
-
23
-
24
-
25
-
26
-
27
-
28
-
29
-
30
-
31
-
32
-
33
-
34
-
35
-
36
-
37
-
38
-
39
-
 40
40 -
 41
41 -
 42
42 -
 43
43 -
 44
44 -
 45
45 -
 46
46 -
 47
47 -
 48
48 -
 49
49 -
 50
50 -
 51
51 -
 52
52 -
 53
53 -
 54
54 -
 55
55 -
 56
56 -
 57
57 -
 58
58 -
 59
59 -
 60
60 -
61
-
62
-
63
-
64
-
65
-
66
-
67
-
68
-
69
-
70
-
71
-
72
-
73
-
74
-
75
-
76
-
77
-
78
-
79
-
80
-
81
-
82
-
83
-
84
-
85
-
86
-
87
-
88
-
89
-
90
-
91
-
92
-
93
-
94
-
95
-
96
-
97
-
98
-
99
-
100
-
101
-
102
-
103
-
104
-
105
-
106
-
107
-
108
 |
 |

Management’s Discussion and Analysis of
Financial Condition and Results of Operations
48
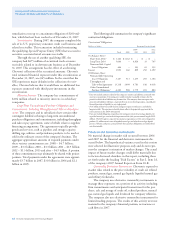
million. A 1 percent increase in the discount rate for this same
plan, which accounted for about 60 percent of the company-
wide pension obligation, would have reduced total pension
plan expense for 2007 by approximately $155 million.
An increase in the discount rate would decrease the pen-
sion obligation, thus changing the funded status of a plan
recorded on the Consolidated Balance Sheet. The total pen-
sion liability on the Consolidated Balance Sheet at December
31, 2007, for underfunded plans was approximately $1.7 bil-
lion. As an indication of the sensitivity of pension liabilities
to the discount rate assumption, a 0.25 percent increase in the
discount rate applied to the company’s primary U.S. pension
plan would have reduced the plan obligation by approximately
$250 million, which would have increased the plan’s over-
funded status from approximately $160 million to $410
million. Other plans would be less underfunded as discount
rates increase. The actual rates of return on plan assets and
discount rates may vary significantly from estimates because
of unanticipated changes in the world’s financial markets.
In 2007, the company’s pension plan contributions were
$317 million (including $78 million to the U.S. plans). In
2008, the company estimates contributions will be approxi-
mately $500 million. Actual contribution amounts are
dependent upon plan-investment results, changes in pension
obligations, regulatory requirements and other economic
factors. Additional funding may be required if investment
returns are insufficient to offset increases in plan obligations.
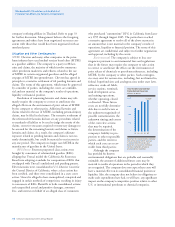
For the company’s OPEB plans, expense for 2007 was
$233 million and the total liability, which reflected the under-
funded status of the plans at the end of 2007, was $2.9 billion.
As an indication of discount rate sensitivity to the deter-
mination of OPEB expense in 2007, a 1 percent increase
in the discount rate for the company’s primary U.S. OPEB
plan, which accounted for about 75 percent of the company-
wide OPEB expense, would have decreased OPEB expense
by approximately $20 million. A 0.25 percent increase in the
discount rate for the same plan, which accounted for about
87 percent of the companywide OPEB liabilities, would
have decreased total OPEB liabilities at the end of 2007 by
approximately $60 million.
For the main U.S. postretirement medical plan, the
annual increase to company contributions is limited to 4
percent per year. The cap becomes effective in the year of
retirement for pre-Medicare-eligible employees retiring on or
after January 1, 2005. The cap was effective as of January 1,
2005, for pre-Medicare-eligible employees retiring before that
date and all Medicare-eligible retirees. For active employees
and retirees under age 65 whose claims experiences are com-
bined for rating purposes, the assumed health care cost-trend
rates start with 8 percent in 2008 and gradually drop to 5
percent for 2014 and beyond. As an indication of the health
care cost-trend rate sensitivity to the determination of OPEB
expense in 2007, a 1 percent increase in the rates for the
main U.S. OPEB plan, which accounted for about 87 percent
of the companywide OPEB liabilities, would have increased
OPEB expense $8 million.
Differences between the various assumptions used to
determine expense and the funded status of each plan and
actual experience are not included in benefit plan costs in
the year the difference occurs. Instead, the differences are
included in actuarial gain/loss and unamortized amounts
have been reflected in “Accumulated other comprehensive
loss” on the Consolidated Balance Sheet. Refer to Note 20,
beginning on page 75, for information on the $3.3 billion
of before-tax actuarial losses recorded by the company as
of December 31, 2007; a description of the method used to
amortize those costs; and an estimate of the costs to be rec-
ognized in expense during 2008.
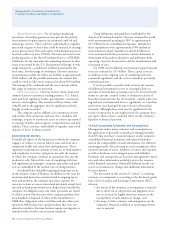
Impairment of Properties, Plant and Equipment and
Investments in Affiliates The company assesses its proper-
ties, plant and equipment (PP&E) for possible impairment
whenever events or changes in circumstances indicate that
the carrying value of the assets may not be recoverable. Such
indicators include changes in the company’s business plans,
changes in commodity prices and, for crude oil and natural
gas properties, significant downward revisions of estimated
proved-reserve quantities. If the carrying value of an asset
exceeds the future undiscounted cash flows expected from
the asset, an impairment charge is recorded for the excess of
carrying value of the asset over its estimated fair value.
Determination as to whether and how much an asset is
impaired involves management estimates on highly uncertain
matters such as future commodity prices, the effects of infla-
tion and technology improvements on operating expenses,
production profiles, and the outlook for global or regional
market supply and demand conditions for crude oil, natural
gas, commodity chemicals and refined products. However,
the impairment reviews and calculations are based on
assumptions that are consistent with the company’s business
plans and long-term investment decisions.
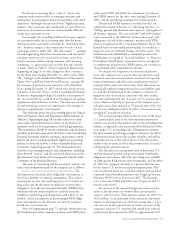
No major individual impairments of PP&E were
recorded for the three years ending December 31, 2007. An
estimate as to the sensitivity to earnings for these periods if
other assumptions had been used in impairment reviews and
impairment calculations is not practicable, given the broad
range of the company’s PP&E and the number of assump-
tions involved in the estimates. That is, favorable changes to
some assumptions might have avoided the need to impair any
assets in these periods, whereas unfavorable changes might
have caused an additional unknown number of other assets
to become impaired.
Investments in common stock of affiliates that are
accounted for under the equity method, as well as investments
in other securities of these equity investees, are reviewed for