Chevron 2007 Annual Report Download - page 33
Download and view the complete annual report
Please find page 33 of the 2007 Chevron annual report below. You can navigate through the pages in the report by either clicking on the pages listed below, or by using the keyword search tool below to find specific information within the annual report.-
 1
1 -
2
-
3
-
4
-
5
-
6
-
7
-
8
-
9
-
10
-
11
-
12
-
13
-
14
-
15
-
16
-
17
-
18
-
19
-
20
-
21
-
22
-
 23
23 -
 24
24 -
 25
25 -
 26
26 -
 27
27 -
 28
28 -
 29
29 -
 30
30 -
 31
31 -
 32
32 -
 33
33 -
 34
34 -
 35
35 -
 36
36 -
 37
37 -
 38
38 -
 39
39 -
 40
40 -
 41
41 -
 42
42 -
 43
43 -
44
-
45
-
46
-
47
-
48
-
49
-
50
-
51
-
52
-
53
-
54
-
55
-
56
-
57
-
58
-
59
-
60
-
61
-
62
-
63
-
64
-
65
-
66
-
67
-
68
-
69
-
70
-
71
-
72
-
73
-
74
-
75
-
76
-
77
-
78
-
79
-
80
-
81
-
82
-
83
-
84
-
85
-
86
-
87
-
88
-
89
-
90
-
91
-
92
-
93
-
94
-
95
-
96
-
97
-
98
-
99
-
100
-
101
-
102
-
103
-
104
-
105
-
106
-
107
-
108
 |
 |

31
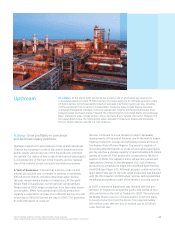
Upstream Earnings for the upstream segment are closely
aligned with industry price levels for crude oil and natural
gas. Crude oil and natural gas prices are subject to external
factors over which the company has no control, including
product demand connected with global economic conditions,
industry inventory levels, production quotas imposed by the
Organization of Petroleum Exporting Countries (OPEC),
weather-related damage and disruptions, competing fuel
prices, and regional supply interruptions or fears thereof that
may be caused by military conflicts, civil unrest or political
uncertainty. Moreover, any of these factors could also inhibit
the company’s production capacity in an affected region.
The company monitors developments closely in the countries
in which it operates and holds investments, and attempts to
manage risks in operating its facilities and business.
Price levels for capital and exploratory costs and operat-
ing expenses associated with the efficient production of crude
oil and natural gas can also be subject to external factors
beyond the company’s control. External factors include not
only the general level of inflation but also prices charged by
the industry’s material and service providers, which can be
affected by the volatility of the industry’s own supply and
demand conditions for such materials and services. The
oil and gas industry worldwide has experienced significant
price increases for these items since 2005, and future price
increases may continue to exceed the general level of infla-
tion. Capital and exploratory expenditures and operating
expenses also can be affected by damages to production
facilities caused by severe weather or civil unrest.
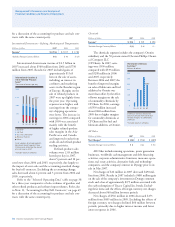
Industry price levels for crude oil increased during
2007. The spot price for West Texas Intermediate (WTI)
crude oil, a benchmark crude oil, averaged $72 per barrel in
2007, up approximately $6 per barrel from the 2006 average
price. The rise in crude oil prices was attributed primarily
to increasing demand in growing economies, the heightened
level of geopolitical uncertainty in some areas of the world
and supply concerns in other key producing regions. As of
mid-February 2008, the WTI price was about $93 per barrel.
As in 2006, a wide differential in prices existed in 2007
between high-quality (i.e., high-gravity, low-sulfur) crude oils
and those of lower quality (i.e., low-gravity, heavier types of
crude). The price for the heavier crudes has been dampened
because of ample supply and lower relative demand due to
the limited number of refineries that are able to process this
lower-quality feedstock into light products (i.e., motor gaso-
line, jet fuel, aviation gasoline and diesel fuel). The price for
higher-quality crude oil has remained high, as the demand
for light products, which can be more easily manufactured by
refineries from high-quality crude oil, has been strong world-
wide. Chevron produces or shares in the production of heavy
crude oil in California, Chad, Indonesia, the Partitioned
Neutral Zone between Saudi Arabia and Kuwait, Venezuela
and certain fields in Angola, China and the United Kingdom
North Sea. (Refer to page 38 for the company’s average U.S.
and international crude oil prices.)
In contrast to price movements in the global market
for crude oil, price changes for natural gas in many regional
markets are more closely aligned with supply and demand
conditions in those markets. In the United States during
2007, benchmark prices at Henry Hub averaged about $7 per
thousand cubic feet (MCF), compared with about $6.50 in
2006. As of mid-February 2008, the Henry Hub price was
about $8 per MCF. Fluctuations in the price for natural gas
in the United States are closely associated with the volumes
produced in North America and the inventory in under-
ground storage relative to customer demand. U.S. natural gas
prices are also typically higher during the winter period when
demand for heating is greatest.
Certain other regions of the world in which the com-
pany operates have different supply, demand and regulatory
circumstances, typically resulting in significantly lower
average sales prices for the company’s production of natural
gas. (Refer to page 38 for the company’s average natural gas
prices for the U.S. and international regions.) Additionally,
excess-supply conditions that exist in certain parts of the
world cannot easily serve to mitigate the relatively high-price
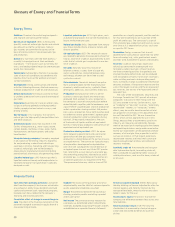
Crude Oil Prices 1987 Through 2007
/. // /0 0' 0( 0) 0* 0+ 0, 0- 0. 0/ 00 '' '( '+') '* ', '- '.
0'%,/
('
.'
-'
,'
(''
0'
/'
+'
*'
)'
009 – Crude Oil Prices 1986 through 2006 – v3
011 – U.S. Natural Gas Prices – v3
'
*'''
)+''
-''
()''
(/''
'%''
/%''
-%''
+%''
)%''
U.S. Natural Gas Realizations
Net Production
'+'* ', '- '.
-%()
(#-00
'
),''
)'''
(,''
('''
,''
10B – Net Crude Oil Nat Gas
Liquids Production back – v3
Net Crude Oil Natural Gas
Liquids Production
'+'* ', '- '.
(#.,-