Chevron 2007 Annual Report Download - page 42
Download and view the complete annual report
Please find page 42 of the 2007 Chevron annual report below. You can navigate through the pages in the report by either clicking on the pages listed below, or by using the keyword search tool below to find specific information within the annual report.-
 1
1 -
2
-
3
-
4
-
5
-
6
-
7
-
8
-
9
-
10
-
11
-
12
-
13
-
14
-
15
-
16
-
17
-
18
-
19
-
20
-
21
-
22
-
23
-
24
-
25
-
26
-
27
-
28
-
29
-
30
-
31
-
 32
32 -
 33
33 -
 34
34 -
 35
35 -
 36
36 -
 37
37 -
 38
38 -
 39
39 -
 40
40 -
 41
41 -
 42
42 -
 43
43 -
 44
44 -
 45
45 -
 46
46 -
 47
47 -
 48
48 -
 49
49 -
 50
50 -
 51
51 -
 52
52 -
53
-
54
-
55
-
56
-
57
-
58
-
59
-
60
-
61
-
62
-
63
-
64
-
65
-
66
-
67
-
68
-
69
-
70
-
71
-
72
-
73
-
74
-
75
-
76
-
77
-
78
-
79
-
80
-
81
-
82
-
83
-
84
-
85
-
86
-
87
-
88
-
89
-
90
-
91
-
92
-
93
-
94
-
95
-
96
-
97
-
98
-
99
-
100
-
101
-
102
-
103
-
104
-
105
-
106
-
107
-
108
 |
 |

Management’s Discussion and Analysis of
Financial Condition and Results of Operations
40
meet unanticipated cash requirements and that during periods
of low prices for crude oil and natural gas and narrow mar-
gins for refined products and commodity chemicals, it has
the flexibility to increase borrowings and/or modify capital-
spending plans to continue paying the common stock dividend
and maintain the company’s high-quality debt ratings.
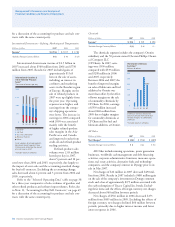
Common stock repurchase program A $5 billion stock
repurchase program initiated in December 2006 was com-
pleted in September 2007. During 2007, about 61.5 million
common shares were acquired under this program at a total
cost of $4.9 billion. Upon completion of this program, the
company authorized the acquisition of up to $15 billion of
additional common shares from time to time at prevailing
prices, as permitted by securities laws and other legal require-
ments and subject to market conditions and other factors.
The program is for a period of up to three years and may
be discontinued at any time. As of December 31, 2007,
23.5 million shares had been acquired under the new pro-
gram for $2.1 billion. Purchases through mid-February
2008 increased the total shares acquired to 34.2 million at a
cost of approximately $3.0 billion.
Capital and exploratory expenditures Total reported
expenditures for 2007 were $20 billion, including $2.3 billion
for the company’s share of affiliates’ expenditures, which
did not require cash outlays by the company. In 2006 and
2005, expenditures were $16.6 billion and $11.1 billion,
respectively, including the company’s share of affiliates’
expenditures of $1.9 billion and $1.7 billion in the corre-
sponding periods. The 2005 amount excludes $17.3 billion
for the acquisition of Unocal Corporation.
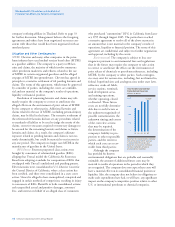
Of the $20 billion in expenditures for 2007, about
three-fourths, or $15.5 billion, related to upstream activi-
ties. Approximately the same percentage was also expended
for upstream operations in 2006 and 2005. International
upstream accounted for about 70 percent of the worldwide
upstream investment in each of the three years, reflecting the
company’s continuing focus on opportunities that are avail-
able outside the United States.
In 2008, the company estimates capital and exploratory
expenditures will be 15 percent higher at $22.9 billion,
including $2.6 billion of spending by affiliates. About
three-fourths of the total, or $17.5 billion, is budgeted for
exploration and production activities, with $12.7 billion of
this amount outside the United States. Spending in 2008
is primarily targeted for exploratory prospects in the deep-
water U.S. Gulf of Mexico and western Africa and major
development projects in Angola, Australia, Brazil, Indo-
nesia, Kazakhstan, Nigeria, Thailand, the deepwater U.S.
Gulf of Mexico, the Piceance Basin in Colorado and an oil
sands project in Canada.
Worldwide downstream
spending in 2008 is esti-
mated at $4.1 billion, with
about $2.3 billion for proj-
ects in the United States.
Capital projects include
upgrades to refineries in the
United States and South
Korea and construction
of gas-to-liquids facilities
in support of associated
upstream projects.
Investments in chemi-
cals, technology and other
corporate businesses in 2008
are budgeted at $1.3 billion.
Technology investments
include projects related to
unconventional hydrocar-
bon technologies, oil and
gas reservoir management
and gas-fired and renewable
power generation.
'%'
)'%'
('%'
(,%'
,%'
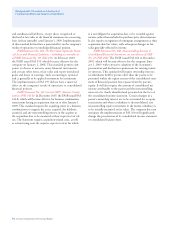
015 – Exp Prod – Cap Exploratory
Expend – v2
Exploration Production
Capital Exploratory
Expenditures
'+'* ', '- '.
(,%,
Capital and Exploratory Expenditures
2007 2006 2005
Millions of dollars U.S. Int’l. Total U.S. Int’l. Total U.S. Int’l. Total
Upstream – Exploration and Production $ 4,558 $ 10,980 $ 15,538 $ 4,123 $ 8,696 $ 12,819 $ 2,450 $ 5,939 $ 8,389
Downstream – Refining, Marketing and
Transportation 1,576 1,867 3,443 1,176 1,999 3,175 818 1,332 2,150
Chemicals 218 53 271 146 54 200 108 43 151
All Other 768 6 774 403 14 417 329 44 373
Total $ 7,120 $ 12,906 $ 20,026 $ 5,848 $ 10,763 $ 16,611 $ 3,705 $ 7,358 $ 11,063
Total, Excluding Equity in Affiliates $ 6,900 $ 10,790 $ 17,690 $ 5,642 $ 9,050 $ 14,692 $ 3,522 $ 5,860 $ 9,382