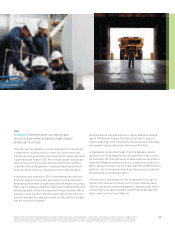
Chevron 2007 Annual Report Download - page 37
Download and view the complete annual report
Please find page 37 of the 2007 Chevron annual report below. You can navigate through the pages in the report by either clicking on the pages listed below, or by using the keyword search tool below to find specific information within the annual report.-
 1
1 -
2
-
3
-
4
-
5
-
6
-
7
-
8
-
9
-
10
-
11
-
12
-
13
-
14
-
15
-
16
-
17
-
18
-
19
-
20
-
21
-
22
-
23
-
24
-
25
-
26
-
 27
27 -
 28
28 -
 29
29 -
 30
30 -
 31
31 -
 32
32 -
 33
33 -
 34
34 -
 35
35 -
 36
36 -
 37
37 -
 38
38 -
 39
39 -
 40
40 -
 41
41 -
 42
42 -
 43
43 -
 44
44 -
 45
45 -
 46
46 -
 47
47 -
48
-
49
-
50
-
51
-
52
-
53
-
54
-
55
-
56
-
57
-
58
-
59
-
60
-
61
-
62
-
63
-
64
-
65
-
66
-
67
-
68
-
69
-
70
-
71
-
72
-
73
-
74
-
75
-
76
-
77
-
78
-
79
-
80
-
81
-
82
-
83
-
84
-
85
-
86
-
87
-
88
-
89
-
90
-
91
-
92
-
93
-
94
-
95
-
96
-
97
-
98
-
99
-
100
-
101
-
102
-
103
-
104
-
105
-
106
-
107
-
108
 |
 |
35
Refer to the “Selected Operating Data” table, on page 38,
for the three-year comparative production volumes in the
United States.
International Upstream – Exploration and Production
Millions of dollars 2007 2006 2005
Income* $ 10,284 $ 8,872 $ 7,556
*Includes Foreign Currency Effects: $ (417) $ (371) $ 14
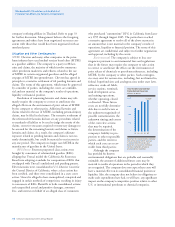
International upstream income of $10.3 billion in 2007
increased $1.4 billion from 2006. Earnings in 2007 benefited
approximately $1.6 billion from higher prices, primarily for
crude oil, and $300 million from increased liftings. Non-
recurring income tax items also benefited earnings between
periods. These benefits to income were partially offset by the
impact of higher operating and depreciation expenses.
Income in 2006 of approximately $8.9 billion increased
$1.3 billion from 2005. Earnings in 2006 benefited approxi-
mately $3 billion from higher prices for crude oil and natural
gas and an additional seven months of production from the
former Unocal properties. About 70 percent of this benefit
was associated with the impact of higher prices. Substan-
tially offsetting these benefits were increases in depreciation
expense, operating expense and exploration expense. Also
adversely affecting 2006 income were higher taxes related
to an increase in tax rates in the United Kingdom and
Venezuela and settlement of tax claims and other tax items
in Venezuela, Angola and Chad. Foreign currency effects
reduced earnings by $371 million in 2006, but increased
income $14 million in 2005.
The company’s average realization for crude oil and natu-
ral gas liquids in 2007 was $65.01 per barrel, compared with
$57.65 in 2006 and $47.59 in 2005. The average natural gas
realization was $3.90 per thousand cubic feet in 2007, com-
pared with $3.73 and $3.19 in 2006 and 2005, respectively.
Net oil-equivalent production of 1.88 million bar-
rels per day in 2007 declined about 2 percent from 2006
and increased 5 percent from 2005. The volumes for each
year included production from oil sands in Canada and an
operating service agreement in Venezuela until its conver-
sion to a joint-stock company in October 2006. The decline
between 2006 and 2007 was associated with the impact of
this contract conversion in Venezuela and the price effects
on production volumes calculated under production-sharing
agreements. Partially offsetting the decline was increased pro-
duction in Bangladesh, Angola and Azerbaijan. The increase
from 2005 was due to that year having included only five
months of production from the former Unocal properties.
The net liquids component of oil-equivalent produc-
tion was 1.3 million barrels per day in 2007, a decrease of
approximately 4 percent from 2006 and 3 percent from
2005. Net natural gas production of 3.3 billion cubic feet per
day in 2007 was up 5.5 percent and 28 percent from 2006
and 2005, respectively.
Refer to the “Selected Operating Data” table, on page
38, for the three-year comparative of international produc-
tion volumes.
'
(/''
(,''
()''
0''
-''
*''
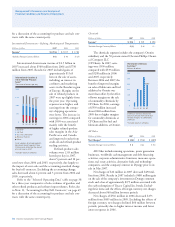
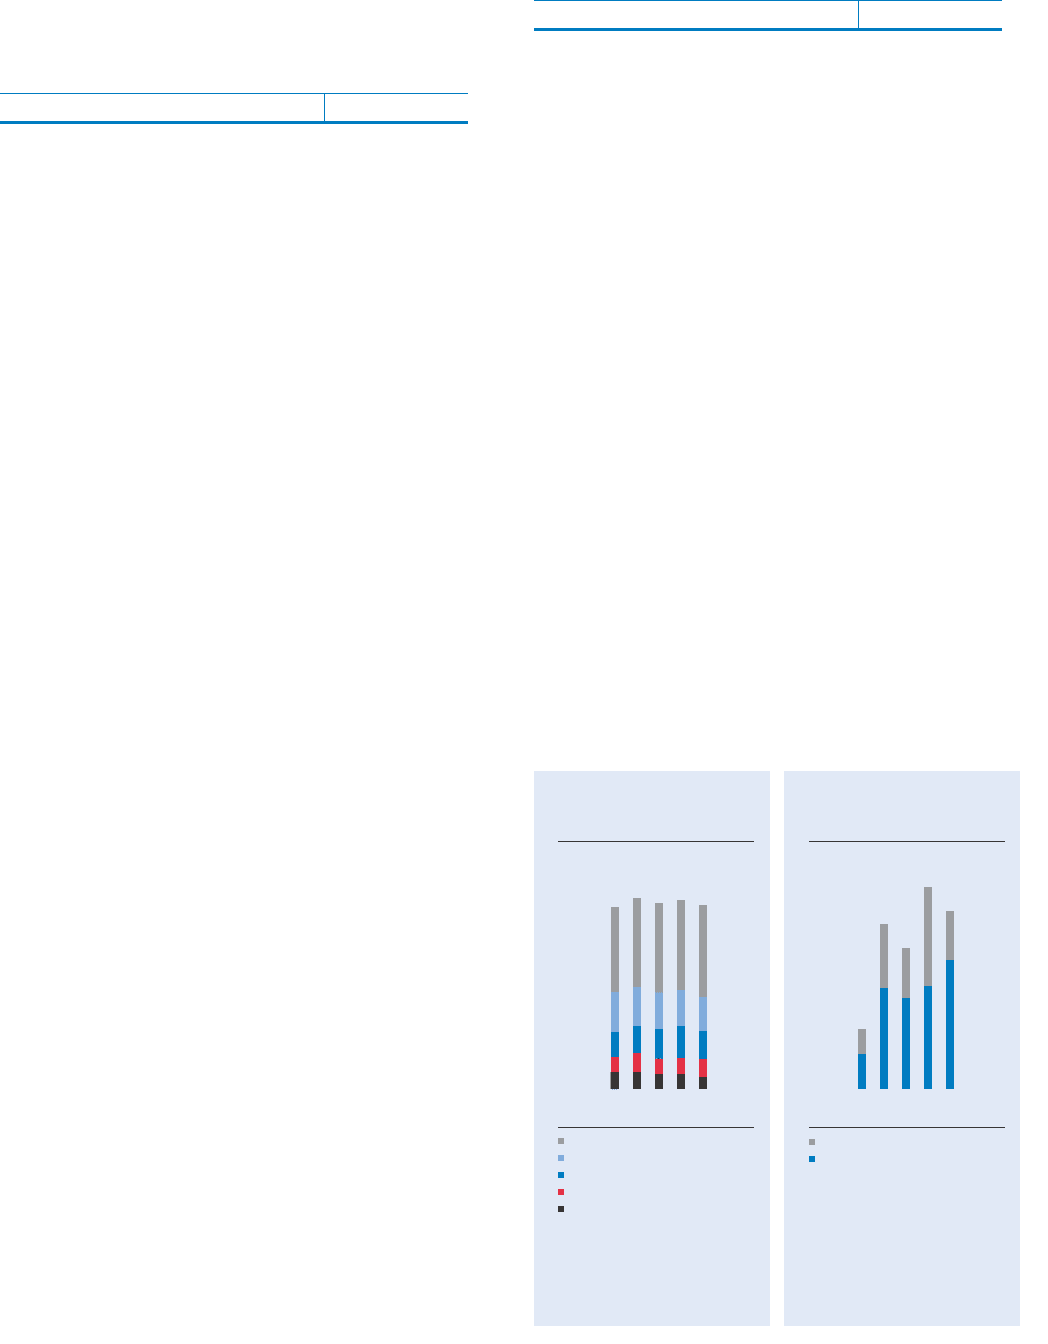
018 – U.S. Gas Other Refined
Prod Sales – v7
U.S. Gasoline Other
Refined-Product Sales
(#+,.
'+'* ', '- '.
'%'
+%,
+%'
*%,
*%'
)%,
'%,
)%'
(%'
(%,
orldwide Refining, Marketing
Transportation Earnings
'+'* ', '- '.
*%,
019 – Refining, Marketing
Trans Earnings – v8
U.S. Downstream – Refining, Marketing and Transportation
Millions of dollars 2007 2006 2005
Income $ 966 $ 1,938 $ 980
U.S. downstream earnings of $966 million in 2007
declined nearly $1 billion from 2006 and were essentially the
same as 2005. The decline in 2007 from 2006 was associ-
ated mainly with weaker refined-product margins due to the
effects of higher crude oil prices and the negative impacts
of higher planned and unplanned downtime on refinery
production volumes at the company’s three major refineries.
Operating expenses were also higher in 2007. The improve-
ment in 2006 earnings from 2005 was primarily associated
with higher average refined-product margins in 2006 and the
adverse effect of downtime in 2005 at refining, marketing
and pipeline operations that was caused by hurricanes in the
Gulf of Mexico.
Sales volumes of refined products were 1.46 million bar-
rels per day in 2007, a decrease of 3 percent and 1 percent
from 2006 and 2005, respectively. The reported sales volume
for 2007 was on a different basis than 2006 and 2005 due to
a change in accounting rules that became effective April 1,
2006, for certain purchase and sale (buy/sell) contracts with
the same counterparty. Excluding the impact of this account-
ing standard, refined-product sales in 2007 decreased
1 percent from 2006 and increased about 5 percent from 2005.
Branded gasoline sales volumes of 629,000 barrels per day
in 2007 increased about 2 percent from 2006 and 6 percent
from 2005, largely due to growth of the Texaco brand.
Refer to the “Selected Operating Data” table on page 38
for a three-year comparative of sales volumes of gasoline and
other refined products and refinery-input volumes. Refer also
to Note 13, “Accounting for Buy/Sell Contracts,” on page 69