Chevron 2007 Annual Report Download - page 71
Download and view the complete annual report
Please find page 71 of the 2007 Chevron annual report below. You can navigate through the pages in the report by either clicking on the pages listed below, or by using the keyword search tool below to find specific information within the annual report.-
 1
1 -
2
-
3
-
4
-
5
-
6
-
7
-
8
-
9
-
10
-
11
-
12
-
13
-
14
-
15
-
16
-
17
-
18
-
19
-
20
-
21
-
22
-
23
-
24
-
25
-
26
-
27
-
28
-
29
-
30
-
31
-
32
-
33
-
34
-
35
-
36
-
37
-
38
-
39
-
40
-
41
-
42
-
43
-
44
-
45
-
46
-
47
-
48
-
49
-
50
-
51
-
52
-
53
-
54
-
55
-
56
-
57
-
58
-
59
-
60
-
 61
61 -
 62
62 -
 63
63 -
 64
64 -
 65
65 -
 66
66 -
 67
67 -
 68
68 -
 69
69 -
 70
70 -
 71
71 -
 72
72 -
 73
73 -
 74
74 -
 75
75 -
 76
76 -
 77
77 -
 78
78 -
 79
79 -
 80
80 -
 81
81 -
82
-
83
-
84
-
85
-
86
-
87
-
88
-
89
-
90
-
91
-
92
-
93
-
94
-
95
-
96
-
97
-
98
-
99
-
100
-
101
-
102
-
103
-
104
-
105
-
106
-
107
-
108
 |
 |

69
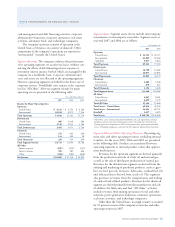
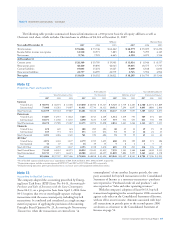
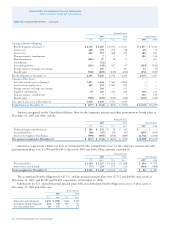
At December 31 Year ended December 31
Gross Investment at Cost Net Investment Additions at Cost1 Depreciation Expense2
2007 2006 2005 2007 2006 2005 2007 2006 2005 2007 2006 2005
Upstream
United States $ 50,991 $ 46,191 $ 43,390 $ 19,850 $ 16,706 $ 15,327 $ 5,725 $ 3,739 $ 2,160 $ 2,700 $ 2,374 $ 1,869
International 71,408 61,281 54,497 43,431 37,730 34,311 10,512 7,290 4,897 4,605 3,888 2,804
Total Upstream 122,399 107,472 97,887 63,281 54,436 49,638 16,237 11,029 7,057 7,305 6,262 4,673
Downstream
United States 15,807 14,553 13,832 7,685 6,741 6,169 1,514 1,109 793 509 474 461
International 10,471 11,036 11,235 4,690 5,233 5,529 519 532 453 633 551 550
Total Downstream 26,278 25,589 25,067 12,375 11,974 11,698 2,033 1,641 1,246 1,142 1,025 1,011
Chemicals
United States 678 645 624 308 289 282 40 25 12 19 19 19
International 815 771 721 453 431 402 53 54 43 26 24 23
Total Chemicals 1,493 1,416 1,345 761 720 684 93 79 55 45 43 42
All Other3
United States 3,873 3,243 3,127 2,179 1,709 1,655 680 270 199 215 171 186
International 41 27 20 14 19 15 5 8 4 1 5 1
Total All Other 3,914 3,270 3,147 2,193 1,728 1,670 685 278 203 216 176 187
Total United States 71,349 64,632 60,973 30,022 25,445 23,433 7,959 5,143 3,164 3,443 3,038 2,535
Total International 82,735 73,115 66,473 48,588 43,413 40,257 11,089 7,884 5,397 5,265 4,468 3,378
Total $ 154,084 $ 137,747 $ 127,446 $ 78,610 $ 68,858 $ 63,690 $ 19,048 $ 13,027 $ 8,561 $ 8,708 $ 7,506 $ 5,913
1 Net of dry hole expense related to prior years’ expenditures of $89, $120 and $28 in 2007, 2006 and 2005, respectively.
2 Depreciation expense includes accretion expense of $399, $275 and $187 in 2007, 2006 and 2005, respectively.
3 Primarily mining operations, power generation businesses, real estate assets and management information systems.
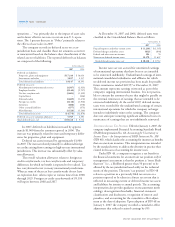
The following table provides summarized financial information on a 100 percent basis for all equity affiliates as well as
Chevron’s total share, which includes Chevron loans to affiliates of $4,124 at December 31, 2007.
Affiliates Chevron Share
Year ended December 31 2007 2006 2005 2007 2006 2005
Total revenues $ 94,864 $ 73,746 $ 64,642 $ 46,579 $ 35,695 $ 31,252
Income before income tax expense 12,510 10,973 7,883 5,836 5,295 4,165
Net income 9,743 7,905 6,645 4,550 4,072 3,534
At December 31
Current assets $ 26,360 $ 19,769 $ 19,903 $ 11,914 $ 8,944 $ 8,537
Noncurrent assets 48,440 49,896 46,925 19,045 18,575 17,747
Current liabilities 19,033 15,254 13,427 9,009 6,818 6,034
Noncurrent liabilities 22,757 24,059 26,579 3,745 3,902 4,906
Net equity $ 33,010 $ 30,352 $ 26,822 $ 18,205 $ 16,799 $ 15,344
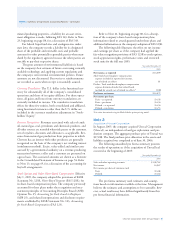
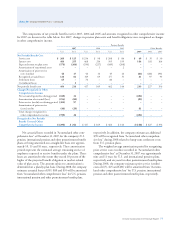
The company adopted the accounting prescribed by Emerg-
ing Issues Task Force (EITF) Issue No. 04-13, Accounting for
Purchases and Sales of Inventory with the Same Counterparty
(Issue 04-13), on a prospective basis from April 1, 2006. Issue
04-13 requires that two or more legally separate exchange
transactions with the same counterparty, including buy/sell
transactions, be combined and considered as a single arrange-
ment for purposes of applying the provisions of Accounting
Principles Board Opinion No. 29, Accounting for Nonmonetary
Transactions, when the transactions are entered into “in
contemplation” of one another. In prior periods, the com-
pany accounted for buy/sell transactions in the Consolidated
Statement of Income as a monetary transaction – purchases
were reported as “Purchased crude oil and products”; sales
were reported as “Sales and other operating revenues.”
With the company’s adoption of Issue 04-13, buy/sell
transactions beginning in the second quarter 2006 are netted
against each other on the Consolidated Statement of Income,
with no effect on net income. Amounts associated with buy/
sell transactions in periods prior to the second quarter 2006
are shown as a footnote to the Consolidated Statement of
Income on page 54.