Chevron 2007 Annual Report Download - page 92
Download and view the complete annual report
Please find page 92 of the 2007 Chevron annual report below. You can navigate through the pages in the report by either clicking on the pages listed below, or by using the keyword search tool below to find specific information within the annual report.-
 1
1 -
2
-
3
-
4
-
5
-
6
-
7
-
8
-
9
-
10
-
11
-
12
-
13
-
14
-
15
-
16
-
17
-
18
-
19
-
20
-
21
-
22
-
23
-
24
-
25
-
26
-
27
-
28
-
29
-
30
-
31
-
32
-
33
-
34
-
35
-
36
-
37
-
38
-
39
-
40
-
41
-
42
-
43
-
44
-
45
-
46
-
47
-
48
-
49
-
50
-
51
-
52
-
53
-
54
-
55
-
56
-
57
-
58
-
59
-
60
-
61
-
62
-
63
-
64
-
65
-
66
-
67
-
68
-
69
-
70
-
71
-
72
-
73
-
74
-
75
-
76
-
77
-
78
-
79
-
80
-
81
-
 82
82 -
 83
83 -
 84
84 -
 85
85 -
 86
86 -
 87
87 -
 88
88 -
 89
89 -
 90
90 -
 91
91 -
 92
92 -
 93
93 -
 94
94 -
 95
95 -
 96
96 -
 97
97 -
 98
98 -
 99
99 -
 100
100 -
 101
101 -
 102
102 -
103
-
104
-
105
-
106
-
107
-
108
 |
 |

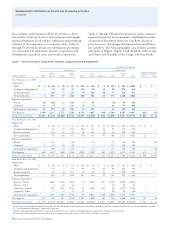
90
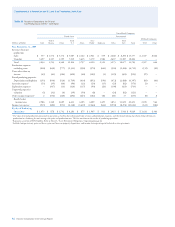
Consolidated Companies
United States International
Gulf of Total Asia- Total Affiliated Companies
Millions of dollars Calif. Mexico Other U.S. Africa Pacific Indonesia Other Int’l. Total TCO Other
At Dec. 31, 2005
Unproved properties $ 769 $ 1,077 $ 397 $ 2,243 $ 407 $ 2,287 $ 645 $ 983 $ 4,322 $ 6,565 $ 108 $ –
Proved properties and
related producing assets 9,546 18,283 11,467 39,296 8,404 14,928 6,613 9,627 39,572 78,868 2,264 1,213
Support equipment 204 193 230 627 715 426 1,217 356 2,714 3,341 549 –
Deferred exploratory wells – 284 5 289 245 154 173 248 820 1,109 – –
Other uncompleted
projects 149 782 209 1,140 2,878 790 427 946 5,041 6,181 2,332 –
Gross Cap. Costs 10,668 20,619 12,308 43,595 12,649 18,585 9,075 12,160 52,469 96,064 5,253 1,213
Unproved properties
valuation 736 90 22 848 162 69 – 318 549 1,397 17 –
Proved producing
properties –
Depreciation and
depletion 6,818 14,067 6,049 26,934 4,266 4,016 4,105 5,720 18,107 45,041 460 90
Support equipment
depreciation 140 119 149 408 317 88 680 222 1,307 1,715 213 –
Accumulated provisions 7,694 14,276 6,220 28,190 4,745 4,173 4,785 6,260 19,963 48,153 690 90
Net Capitalized Costs $ 2,974 $ 6,343 $ 6,088 $ 15,405 $ 7,904 $ 14,412 $ 4,290 $ 5,900 $ 32,506 $ 47,911 $ 4,563 $ 1,123
Supplemental Information on Oil and Gas Producing Activities