Chevron 2007 Annual Report Download - page 45
Download and view the complete annual report
Please find page 45 of the 2007 Chevron annual report below. You can navigate through the pages in the report by either clicking on the pages listed below, or by using the keyword search tool below to find specific information within the annual report.-
 1
1 -
2
-
3
-
4
-
5
-
6
-
7
-
8
-
9
-
10
-
11
-
12
-
13
-
14
-
15
-
16
-
17
-
18
-
19
-
20
-
21
-
22
-
23
-
24
-
25
-
26
-
27
-
28
-
29
-
30
-
31
-
32
-
33
-
34
-
 35
35 -
 36
36 -
 37
37 -
 38
38 -
 39
39 -
 40
40 -
 41
41 -
 42
42 -
 43
43 -
 44
44 -
 45
45 -
 46
46 -
 47
47 -
 48
48 -
 49
49 -
 50
50 -
 51
51 -
 52
52 -
 53
53 -
 54
54 -
 55
55 -
56
-
57
-
58
-
59
-
60
-
61
-
62
-
63
-
64
-
65
-
66
-
67
-
68
-
69
-
70
-
71
-
72
-
73
-
74
-
75
-
76
-
77
-
78
-
79
-
80
-
81
-
82
-
83
-
84
-
85
-
86
-
87
-
88
-
89
-
90
-
91
-
92
-
93
-
94
-
95
-
96
-
97
-
98
-
99
-
100
-
101
-
102
-
103
-
104
-
105
-
106
-
107
-
108
 |
 |

43
The company’s market exposure positions are moni-
tored and managed on a daily basis by an internal Risk
Control group to ensure compliance with the company’s risk
management policies that have been approved by the Audit
Committee of the company’s Board of Directors.
The derivative instruments used in the company’s risk
management and trading activities consist mainly of futures,
options and swap contracts traded on the NYMEX (New
York Mercantile Exchange) and on electronic platforms of
ICE (Inter-Continental Exchange) and GLOBEX (Chicago
Mercantile Exchange). In addition, crude oil, natural gas
and refined-product swap contracts and option contracts are
entered into principally with major financial institutions and
other oil and gas companies in the “over-the-counter” markets.
Virtually all derivatives beyond those designated as nor-
mal purchase and normal sale contracts are recorded at fair
value on the Consolidated Balance Sheet with resulting gains
and losses reflected in income. Fair values are derived prin-
cipally from published market quotes and other independent
third-party quotes.
Effective with 2007 year-end reporting, the company
changed the model used to quantify information about
market risk for its commodity derivatives from a “sensitivity
analysis” approach to Value-at-Risk (VaR). The major reason
for the change is that VaR allows estimation of a portfolio’s
aggregate market risk exposure and takes into account cor-
relations between trading assets. Therefore, it reflects risk
reduction due to diversification or hedging activities. Most
of the company’s market positions are time and commodity
spreads, and the company believes that VaR is a more accu-
rate tool to measure this type of exposure than the sensitivity
analysis model. The company fully developed and tested its
VaR model during 2007.
VaR is the maximum loss not to be exceeded within a
given probability or confidence level over a given period of
time. The company’s VaR model uses the Monte Carlo simu-
lation method that involves generating hypothetical scenarios
from the specified probability distribution and constructing a
full distribution of a potential portfolio’s values.
The VaR model utilizes an exponentially weighted
moving average for computing historical volatilities and cor-
relations, a 95 percent confidence level, and one-day holding
period. That is, the company’s 95 percent, one-day VaR cor-
responds to the unrealized loss in portfolio value that would
not be exceeded on average more than one in every 20 trad-
ing days, if the portfolio were held constant for one day.
The one-day holding period is based on the assump-
tion that market-risk positions can be liquidated or hedged
within one day. For hedging and risk management, the com-
pany uses conventional exchange-traded instruments such as
futures and options, as well as nonexchange-traded swaps,
most of which can be liquidated or hedged effectively within
one day. The table below presents 95 percent/one-day VaR
for each of the company’s primary risk exposures in the area
of commodity derivative instruments at December 31, 2007:
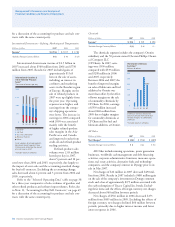
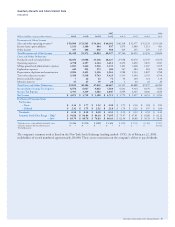
Millions of dollars 2007
Crude Oil $ 29
Natural Gas 3
Refined Products 23
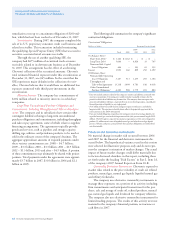
Sensitivity analysis for the company’s open commodity
derivative instruments at December 31, 2007, and Decem-
ber 31, 2006, based on a hypothetical 10 percent increase in
commodity prices, is provided in the following table:
Incremental Increase (Decrease) in Fair Value of Open Commodity
Derivative Contracts Assuming a Hypothetical Increase in
Year-End Commodity Prices of 10 Percent
Millions of dollars 2007 2006
Crude Oil $ (113) $ 4
Natural Gas 14 10
Refined Products (96) (30)
The same hypothetical decrease in prices of these com-
modities would result in approximately the same opposite effects
on the fair values of the contracts. The hypothetical effect on
these contracts was estimated by calculating the fair value of the
contracts as the difference between the hypothetical and current
market prices multiplied by the contract amounts.
The change in the amounts between years in the table
above for crude oil and refined products is associated with an
increase in commodity prices, volumes hedged and the use of
longer-term contracts.
Foreign Currency The company enters into forward
exchange contracts, generally with terms of 180 days or less,
to manage some of its foreign currency exposures. These expo-
sures include revenue and anticipated purchase transactions,
including foreign currency capital expenditures and lease com-
mitments, forecasted to occur within 180 days. The forward
exchange contracts are recorded at fair value on the balance
sheet with resulting gains and losses reflected in income.
The aggregate effect of a hypothetical 10 percent increase
in the value of the U.S. dollar at year-end 2007 would be a
reduction in the fair value of the foreign exchange contracts of
approximately $75 million. The effect would be the opposite
for a hypothetical 10 percent decrease in the value of the U.S.
dollar at year-end 2007.
Interest Rates The company enters into interest rate
swaps as part of its overall strategy to manage the interest
rate risk on its debt. Under the terms of the swaps, net cash
settlements are based on the difference between fixed-rate
and floating-rate interest amounts calculated by reference to
agreed notional principal amounts. Interest rate swaps related
to a portion of the company’s fixed-rate debt are accounted
for as fair value hedges. Interest rate swaps related to floating-
rate debt are recorded at fair value on the balance sheet with
resulting gains and losses reflected in income. At year-end
2007, the company had no interest-rate swaps on floating-
rate debt. At year-end 2007, the weighted average maturity
of “receive fixed” interest rate swaps was less than one year.
A hypothetical increase or decrease of 10 basis points in fixed
interest rates would have a de minimis impact on the fair
value of the “receive fixed” swaps.
Chevron enters into a number of business arrangements
with related parties, principally its equity affiliates. These
arrangements include long-term supply or offtake agree-
ments. Long-term purchase agreements are in place with the