Chevron 2007 Annual Report Download - page 6
Download and view the complete annual report
Please find page 6 of the 2007 Chevron annual report below. You can navigate through the pages in the report by either clicking on the pages listed below, or by using the keyword search tool below to find specific information within the annual report.-
 1
1 -
 2
2 -
 3
3 -
 4
4 -
 5
5 -
 6
6 -
 7
7 -
 8
8 -
 9
9 -
 10
10 -
 11
11 -
 12
12 -
 13
13 -
 14
14 -
 15
15 -
 16
16 -
 17
17 -
18
-
19
-
20
-
21
-
22
-
23
-
24
-
25
-
26
-
27
-
28
-
29
-
30
-
31
-
32
-
33
-
34
-
35
-
36
-
37
-
38
-
39
-
40
-
41
-
42
-
43
-
44
-
45
-
46
-
47
-
48
-
49
-
50
-
51
-
52
-
53
-
54
-
55
-
56
-
57
-
58
-
59
-
60
-
61
-
62
-
63
-
64
-
65
-
66
-
67
-
68
-
69
-
70
-
71
-
72
-
73
-
74
-
75
-
76
-
77
-
78
-
79
-
80
-
81
-
82
-
83
-
84
-
85
-
86
-
87
-
88
-
89
-
90
-
91
-
92
-
93
-
94
-
95
-
96
-
97
-
98
-
99
-
100
-
101
-
102
-
103
-
104
-
105
-
106
-
107
-
108
 |
 |
4
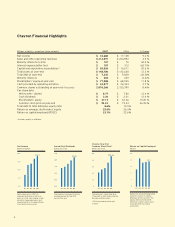
Millions of dollars, except per-share amounts 2007 2006 % Change
Net income $ 18,688 $ 17,138 9.0 %
Sales and other operating revenues $ 214,091 $ 204,892 4.5 %
Minority interests income $ 107 $ 70 52.9 %
Interest expense (after tax) $ 107 $ 312 (65.7)%
Capital and exploratory expenditures* $ 20,026 $ 16,611 20.6 %
Total assets at year-end $ 148,786 $ 132,628 12.2 %
Total debt at year-end $ 7,232 $ 9,838 (26.5)%
Minority interests $ 204 $ 209 (2.4)%
Stockholders’ equity at year-end $ 77,088 $ 68,935 11.8 %
Cash provided by operating activities $ 24,977 $ 24,323 2.7 %
Common shares outstanding at year-end (Thousands) 2,076,266 2,150,390 (3.4)%
Per-share data
Net income – diluted $ 8.77 $ 7.80 12.4 %
Cash dividends $ 2.26 $ 2.01 12.4 %
Stockholders’ equity $ 37.13 $ 32.06 15.81 %
Common stock price at year-end $ 93.33 $ 73.53 26.93 %
Total debt to total debt-plus-equity ratio 8.6% 12.5%
Return on average stockholders’ equity 25.6% 26.0%
Return on capital employed (ROCE) 23.1% 22.6%
Chevron Financial Highlights
*Includes equity in affi liates
'%'
)'%'
(,%'
,%'
('%'
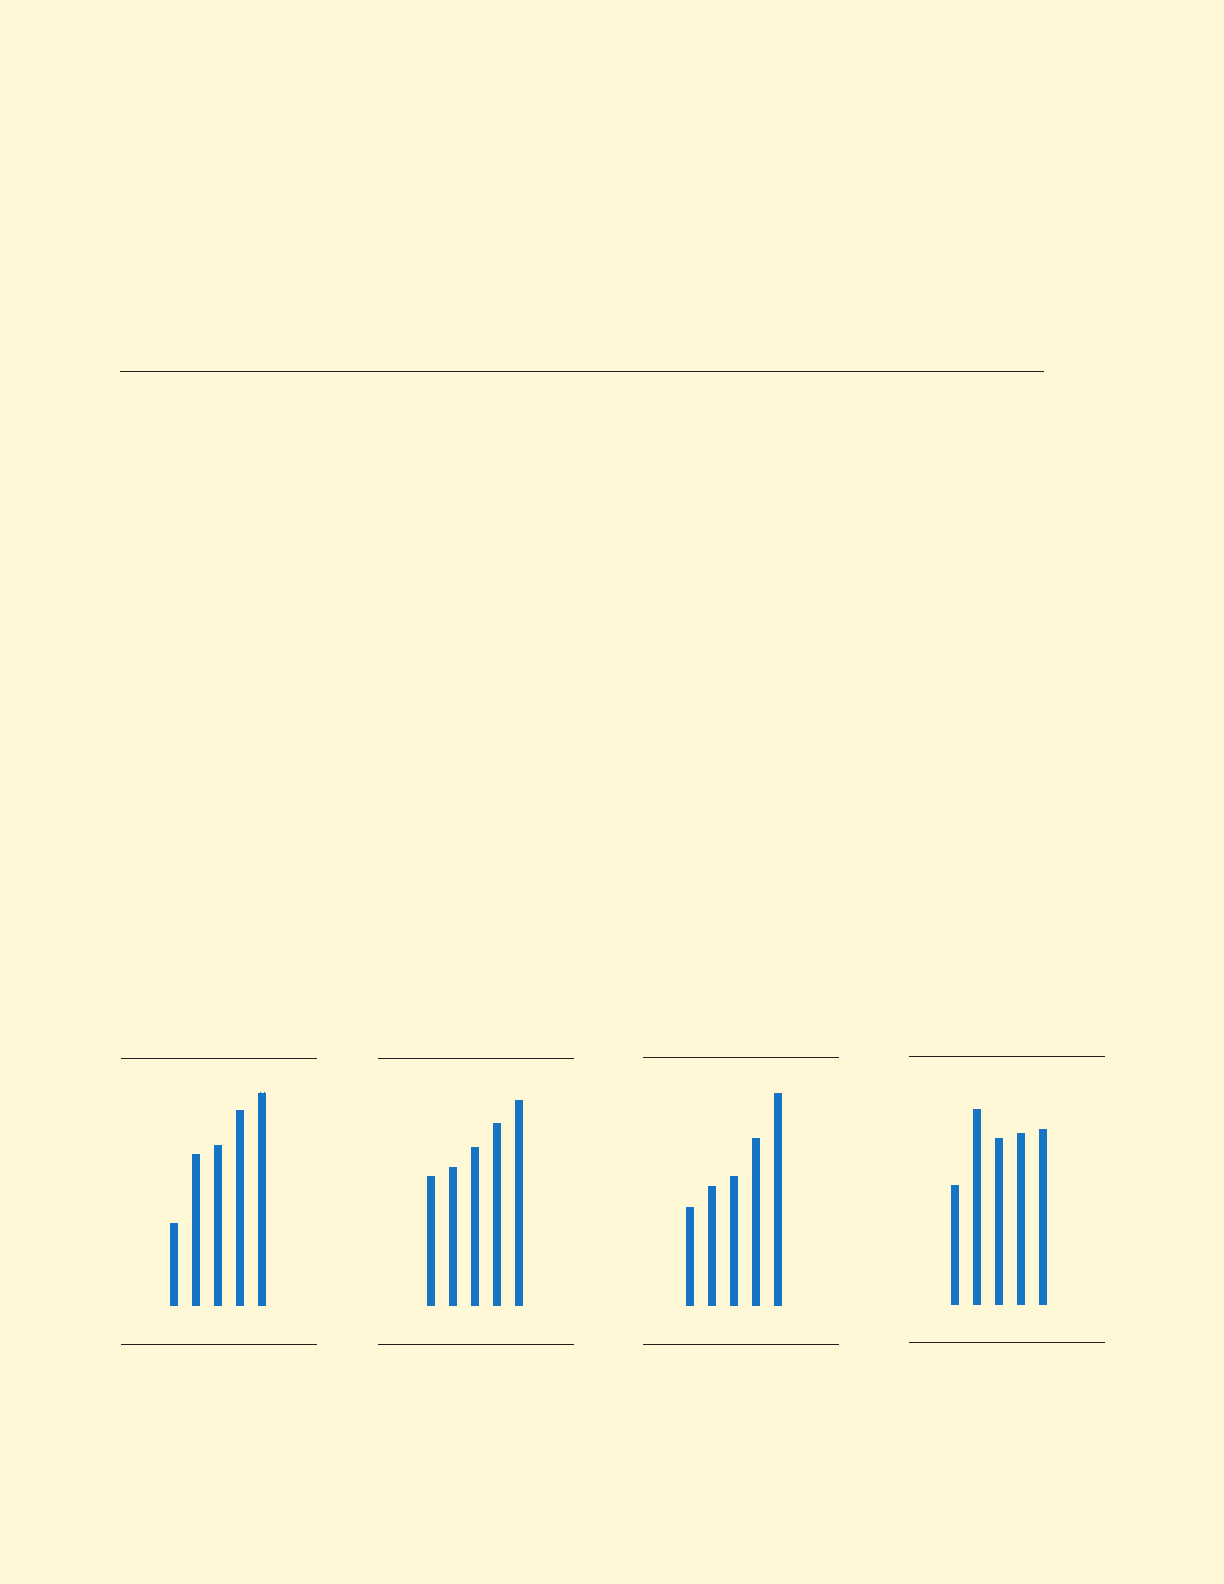
E\k@eZfd\
9`cc`fejf][fccXij
E\k`eZfd\ifj\`e)''.fe
`dgifm\[lgjki\Xdi\jlckjXe[
^X`ejfeXjj\kjXc\j%?`^_\iZil[\
f`cgi`Z\jjhl\\q\[dXi^`ejXe[
cfn\i\[gif]`kj`ek_\[fnejki\Xd
Xe[Z_\d`ZXcjYlj`e\jj\j%
'* ', '- '.
(/%.
'+
'%''
)%,'
)%''
(%,'
(%''
'%,'
8eelXc:Xj_;`m`[\e[j
;fccXijg\ij_Xi\
K_\ZfdgXep`eZi\Xj\[`kjXeelXc
[`m`[\e[gXpflk]fik_\)'k_
Zfej\Zlk`m\p\Xi%
'+
'* ', '- '.
)%)-
'
(''
/'
-'
+'
)'
:_\mifeP\Xi$<e[
:fddfeJkfZbGi`Z\!
;fccXijg\ij_Xi\
K_\ZfdgXepËjjkfZbgi`Z\ifj\
).g\iZ\ek`e)''.#flkgXZ`e^k_\
YifX[\idXib\k`e[\o\j%
!)''*X[aljk\[]fijkfZbjgc`k
`e)''+
'+'* ', '- '.
0*%**
'
*'
)+
(/
()
-
I\kliefe:Xg`kXc<dgcfp\[
G\iZ\ek
I\Zfi[e\k`eZfd\_\cg\[Yffjk
:_\mifeËji\kliefeZXg`kXc
\dgcfp\[kf)*%(g\iZ\ek%K_\
[\Zc`e\]ifd)''+kf)'',
i\]c\Zk\[X_`^_\iZXg`kXcYXj\
i\jlck`e^]ifdk_\LefZXc
XZhl`j`k`fe%
'+'* ', '- '.
)*%(