Chevron 2007 Annual Report Download - page 97
Download and view the complete annual report
Please find page 97 of the 2007 Chevron annual report below. You can navigate through the pages in the report by either clicking on the pages listed below, or by using the keyword search tool below to find specific information within the annual report.-
 1
1 -
2
-
3
-
4
-
5
-
6
-
7
-
8
-
9
-
10
-
11
-
12
-
13
-
14
-
15
-
16
-
17
-
18
-
19
-
20
-
21
-
22
-
23
-
24
-
25
-
26
-
27
-
28
-
29
-
30
-
31
-
32
-
33
-
34
-
35
-
36
-
37
-
38
-
39
-
40
-
41
-
42
-
43
-
44
-
45
-
46
-
47
-
48
-
49
-
50
-
51
-
52
-
53
-
54
-
55
-
56
-
57
-
58
-
59
-
60
-
61
-
62
-
63
-
64
-
65
-
66
-
67
-
68
-
69
-
70
-
71
-
72
-
73
-
74
-
75
-
76
-
77
-
78
-
79
-
80
-
81
-
82
-
83
-
84
-
85
-
86
-
 87
87 -
 88
88 -
 89
89 -
 90
90 -
 91
91 -
 92
92 -
 93
93 -
 94
94 -
 95
95 -
 96
96 -
 97
97 -
 98
98 -
 99
99 -
 100
100 -
 101
101 -
 102
102 -
 103
103 -
 104
104 -
 105
105 -
 106
106 -
 107
107 -
108
 |
 |

95
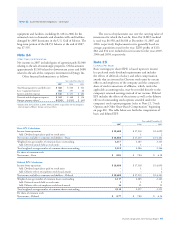
Noteworthy amounts in the categories of liquids
proved-reserve changes for 2005 through 2007 are dis-
cussed below:
Revisions In 2005, net revisions reduced reserves by
239 million and 24 million barrels for worldwide consolidated
companies and equity affiliates, respectively. For consoli-
dated companies, the net decrease was 199 million barrels in
the international areas and 40 million barrels in the United
States. The largest downward net revisions internationally
were 108 million barrels in Indonesia and 53 million barrels
in Kazakhstan, due primarily to the effect of higher year-end
prices on the calculation of reserves associated with production-
sharing and variable-royalty contracts. In the United States,
the 40 million-barrel reduction was across many fields in each
of the geographic sections. Most of the downward revision
for affiliated companies was a 19 million-barrel reduction in
Hamaca, attributable to revised government royalty provisions.
For TCO, the downward effect of higher year-end prices was
partially offset by increased reservoir performance.
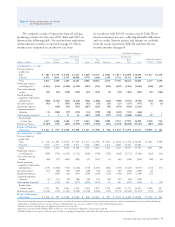
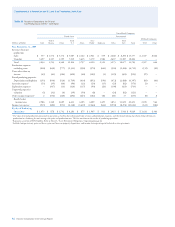
Net Proved Reserves of Crude Oil, Condensate and Natural Gas Liquids
Consolidated Companies
United States International
Gulf of Total Asia- Total Affiliated Companies
Millions of barrels Calif. Mexico Other U.S. Africa Pacific Indonesia Other Int’l. Total TCO Other
Reserves at Jan. 1, 2005 1,011 294 432 1,737 1,833 676 698 567 3,774 5,511 1,994 468
Changes attributable to:
Revisions (23) (6) (11) (40) (29) (56) (108) (6) (199) (239) (5) (19)
Improved recovery 57 – 4 61 67 4 42 29 142 203 – –
Extensions and discoveries – 37 7 44 53 21 1 65 140 184 – –
Purchases1 – 49 147 196 4 287 20 65 376 572 – –
Sales2 (1) – (1) (2) – – – (58) (58) (60) – –
Production (79) (41) (45) (165) (114) (103) (74) (89) (380) (545) (50) (14)
Reserves at Dec. 31, 20053 965 333 533 1,831 1,814 829 579 573 3,795 5,626 1,939 435
Changes attributable to:
Revisions (14) 7 7 – (49) 72 61 (45) 39 39 60 24
Improved recovery 49 – 3 52 13 1 6 11 31 83 – –
Extensions and discoveries – 25 8 33 30 6 2 36 74 107 – –
Purchases1 2 2 – 4 15 – – 2 17 21 – 119
Sales2 – – – – – – – (15) (15) (15) – –
Production (76) (42) (51) (169) (125) (123) (72) (78) (398) (567) (49) (16)
Reserves at Dec. 31, 20063 926 325 500 1,751 1,698 785 576 484 3,543 5,294 1,950 562
Changes attributable to:
Revisions 1 (1) (5) (5) (89) 7 (66) 7 (141) (146) 92 11
Improved recovery 6 – 3 9 7 3 1 – 11 20 – –
Extensions and discoveries 1 25 10 36 6 1 – 17 24 60 – –
Purchases1 1 9 – 10 – – – – – 10 – 316
Sales2 – (8) (1) (9) – – – – – (9) – (432)
Production (75) (43) (50) (168) (122) (128) (72) (74) (396) (564) (53) (24)
Reserves at Dec. 31, 20073,4 860 307 457 1,624 1,500 668 439 434 3,041 4,665 1,989 433
Developed Reserves5
At Jan. 1, 2005 832 192 386 1,410 990 543 490 469 2,492 3,902 1,510 188
At Dec. 31, 2005 809 177 474 1,460 945 534 439 416 2,334 3,794 1,611 196
At Dec. 31, 2006 749 163 443 1,355 893 530 426 349 2,198 3,553 1,003 311
At Dec. 31, 2007 701 136 401 1,238 758 422 363 305 1,848 3,086 1,273 263
1 Includes reserves acquired through nonmonetary transactions.
2 Includes reserves disposed of through nonmonetary transactions.
3 Included are year-end reserve quantities related to production-sharing contracts (PSC) (refer to page 28 for the definition of a PSC). PSC-related reserve quantities are 26 percent,
30 percent and 29 percent for consolidated companies for 2007, 2006 and 2005, respectively.
4 Net reserve changes (excluding production) in 2007 consist of 97 million barrels of developed reserves and (162) million barrels of undeveloped reserves for consolidated companies
and 299 million barrels of developed reserves and (312) million barrels of undeveloped reserves for affiliated companies.
5 During 2007, the percentages of undeveloped reserves at December 31, 2006, transferred to developed reserves were 8 percent and 24 percent for consolidated companies and affili-
ated companies, respectively.
Information on Canadian Oil Sands Net Proved Reserves Not Included Above:
In addition to conventional liquids and natural gas proved reserves, Chevron has significant interests in proved oil sands reserves in Canada associated with the Athabasca project. For internal
management purposes, Chevron views these reserves and their development as an integral part of total upstream operations. However, SEC regulations define these reserves as mining-related and
not a part of conventional oil and gas reserves. Net proved oil sands reserves were 436 million barrels as of December 31, 2007. The oil sands reserves are not considered in the standardized mea-
sure of discounted future net cash flows for conventional oil and gas reserves, which is found on page 100.