Chevron 2007 Annual Report Download - page 64
Download and view the complete annual report
Please find page 64 of the 2007 Chevron annual report below. You can navigate through the pages in the report by either clicking on the pages listed below, or by using the keyword search tool below to find specific information within the annual report.-
 1
1 -
2
-
3
-
4
-
5
-
6
-
7
-
8
-
9
-
10
-
11
-
12
-
13
-
14
-
15
-
16
-
17
-
18
-
19
-
20
-
21
-
22
-
23
-
24
-
25
-
26
-
27
-
28
-
29
-
30
-
31
-
32
-
33
-
34
-
35
-
36
-
37
-
38
-
39
-
40
-
41
-
42
-
43
-
44
-
45
-
46
-
47
-
48
-
49
-
50
-
51
-
52
-
53
-
 54
54 -
 55
55 -
 56
56 -
 57
57 -
 58
58 -
 59
59 -
 60
60 -
 61
61 -
 62
62 -
 63
63 -
 64
64 -
 65
65 -
 66
66 -
 67
67 -
 68
68 -
 69
69 -
 70
70 -
 71
71 -
 72
72 -
 73
73 -
 74
74 -
75
-
76
-
77
-
78
-
79
-
80
-
81
-
82
-
83
-
84
-
85
-
86
-
87
-
88
-
89
-
90
-
91
-
92
-
93
-
94
-
95
-
96
-
97
-
98
-
99
-
100
-
101
-
102
-
103
-
104
-
105
-
106
-
107
-
108
 |
 |

62
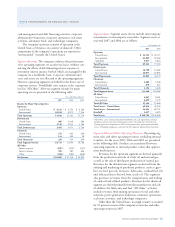
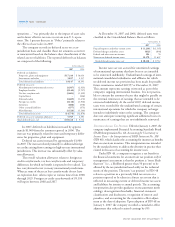
market purchases totaled $7,036, $5,033 and $3,029 in 2007,
2006 and 2005, respectively.
The major components of “Capital expenditures” and
the reconciliation of this amount to the reported capital and
exploratory expenditures, including equity affiliates, presented
in Management’s Discussion and Analysis, beginning on
page 30, are presented in the following table:
Year ended December 31
2007 2006 2005
Additions to properties, plant
and equipment* $ 16,127 $ 12,800 $ 8,154
Additions to investments 881 880 459
Current-year dry hole expenditures 418 400 198
Payments for other liabilities
and assets, net (748) (267) (110)
Capital expenditures 16,678 13,813 8,701
Expensed exploration expenditures 816 844 517
Assets acquired through capital
lease obligations and other
financing obligations 196 35 164
Capital and exploratory expenditures,
excluding equity affiliates 17,690 14,692 9,382
Equity in affiliates’ expenditures 2,336 1,919 1,681
Capital and exploratory expenditures,
including equity affiliates $ 20,026 $ 16,611 $ 11,063
*
Net of noncash additions of $3,560 in 2007, $440 in 2006 and $435 in 2005.
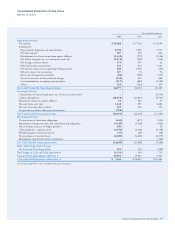
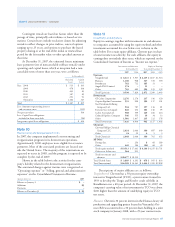
Chevron U.S.A. Inc. (CUSA) is a major subsidiary of
Chevron Corporation. CUSA and its subsidiaries manage
and operate most of Chevron’s U.S. businesses. Assets include
those related to the exploration and production of crude oil,
natural gas and natural gas liquids and those associated with
the refining, marketing, supply and distribution of products
derived from petroleum, other than natural gas liquids,
excluding most of the regulated pipeline operations of
Chevron. CUSA also holds Chevron’s investment in the
Chevron Phillips Chemical Company LLC (CPChem) joint
venture, which is accounted for using the equity method.
During 2007, Chevron implemented legal reorganizations
in which certain Chevron subsidiaries transferred assets to
or under CUSA. The summarized financial information for
CUSA and its consolidated subsidiaries presented in the table
on the following page gives retroactive effect to the reorganiza-
tions as if they had occurred on January 1, 2005. However, the
financial information on the following page may not reflect
the financial position and operating results in the periods pre-
sented if the reorganization actually had occurred on that date.
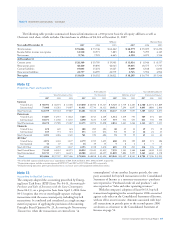
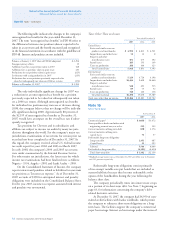
Year ended December 31
2007 2006 2005
Net decrease (increase) in operating working
capital was composed of the following:
(Increase) decrease in accounts and
notes receivable $ (3,867) $ 17 $ (3,164)
Increase in inventories (749) (536) (968)
Increase in prepaid expenses and
other current assets (370) (31) (54)
Increase in accounts payable and
accrued liabilities 4,930 1,246 3,851
Increase in income and other
taxes payable 741 348 281
Net decrease (increase) in operating
working capital $ 685 $ 1,044 $ (54)
Net cash provided by operating
activities includes the following
cash payments for interest and
income taxes:
Interest paid on debt
(net of capitalized interest) $ 203 $ 470 $ 455
Income taxes $ 12,340 $ 13,806 $ 8,875
Net (purchases) sales of
marketable securities consisted
of the following gross amounts:
Marketable securities purchased $ (1,975) $ (1,271) $ (918)
Marketable securities sold 2,160 1,413 1,254
Net sales (purchases) of
marketable securities $ 185 $ 142 $ 336
The Consolidated Statement of Cash Flows does not
include noncash financing and investing activities. Refer to
Note 23, starting on page 84, for a discussion of revisions
to the company’s asset retirement obligations that did not
involve cash receipts or payments in 2007.
In accordance with the cash-flow classification require-
ments of FAS 123R, Share-Based Payment, the “Net decrease
(increase) in operating working capital” includes reductions
of $96 and $94 for excess income tax benefits associated with
stock options exercised during 2007 and 2006, respectively.
These amounts are offset by “Net purchases of treasury shares.”
The 2007 “Net purchases of other short-term investments”
consist of $799 in restricted cash associated with capital-
investment projects at the company’s Pascagoula, Mississippi,
refinery and Angola liquefied natural gas project that was
invested in short-term marketable securities and reclassified
from cash equivalents to a long-term deferred asset on the
Consolidated Balance Sheet. In December 2007, the company
issued a $650 tax exempt Mississippi Gulf Opportunity Zone
Bond as a source of funds for the Pascagoula Refinery project.
The “Net purchases of treasury shares” represents the cost
of common shares acquired in the open market less the cost
of shares issued for share-based compensation plans. Open-
Notes to the Consolidated Financial Statements