Chevron 2007 Annual Report Download - page 94
Download and view the complete annual report
Please find page 94 of the 2007 Chevron annual report below. You can navigate through the pages in the report by either clicking on the pages listed below, or by using the keyword search tool below to find specific information within the annual report.-
 1
1 -
2
-
3
-
4
-
5
-
6
-
7
-
8
-
9
-
10
-
11
-
12
-
13
-
14
-
15
-
16
-
17
-
18
-
19
-
20
-
21
-
22
-
23
-
24
-
25
-
26
-
27
-
28
-
29
-
30
-
31
-
32
-
33
-
34
-
35
-
36
-
37
-
38
-
39
-
40
-
41
-
42
-
43
-
44
-
45
-
46
-
47
-
48
-
49
-
50
-
51
-
52
-
53
-
54
-
55
-
56
-
57
-
58
-
59
-
60
-
61
-
62
-
63
-
64
-
65
-
66
-
67
-
68
-
69
-
70
-
71
-
72
-
73
-
74
-
75
-
76
-
77
-
78
-
79
-
80
-
81
-
82
-
83
-
 84
84 -
 85
85 -
 86
86 -
 87
87 -
 88
88 -
 89
89 -
 90
90 -
 91
91 -
 92
92 -
 93
93 -
 94
94 -
 95
95 -
 96
96 -
 97
97 -
 98
98 -
 99
99 -
 100
100 -
 101
101 -
 102
102 -
 103
103 -
 104
104 -
105
-
106
-
107
-
108
 |
 |

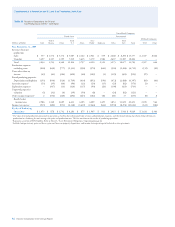
92
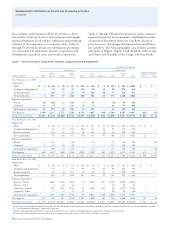
Consolidated Companies
United States International
Gulf of Total Asia- Total Affiliated Companies
Millions of dollars Calif. Mexico Other U.S. Africa Pacific Indonesia Other Int’l. Total TCO Other
Year Ended Dec. 31, 2005
Revenues from net
production
Sales $ 337 $ 1,576 $ 3,174 $ 5,087 $ 2,142 $ 2,941 $ 539 $ 2,668 $ 8,290 $ 13,377 $ 2,307 $ 666
Transfers 3,497 2,127 1,395 7,019 3,615 3,179 1,986 2,607 11,387 18,406 – –
Total 3,834 3,703 4,569 12,106 5,757 6,120 2,525 5,275 19,677 31,783 2,307 666
Production expenses
excluding taxes (916) (638) (777) (2,331) (558) (570) (660) (596) (2,384) (4,715) (152) (82)
Taxes other than on
income (65) (41) (384) (490) (48) (189) (1) (195) (433) (923) (27) –
Proved producing properties:
Depreciation and depletion (253) (936) (520) (1,709) (414) (852) (550) (672) (2,488) (4,197) (83) (46)
Accretion expense2 (13) (35) (46) (94) (22) (20) (15) (25) (82) (176) (1) –
Exploration expenses – (307) (13) (320) (117) (90) (26) (190) (423) (743) – –
Unproved properties
valuation (3) (32) (4) (39) (50) (8) – (24) (82) (121) – –
Other income (expense)3 2 (354) (140) (492) (243) (182) 182 280 37 (455) (9) 8
Results before
income taxes 2,586 1,360 2,685 6,631 4,305 4,209 1,455 3,853 13,822 20,453 2,035 546
Income tax expense (913) (482) (953) (2,348) (3,430) (2,264) (644) (1,938) (8,276) (10,624) (611) (186)
Results of Producing
Operations $ 1,673 $ 878 $ 1,732 $ 4,283 $ 875 $ 1,945 $ 811 $ 1,915 $ 5,546 $ 9,829 $ 1,424 $ 360
1 The value of owned production consumed in operations as fuel has been eliminated from revenues and production expenses, and the related volumes have been deducted from net
production in calculating the unit average sales price and production cost. This has no effect on the results of producing operations.
2 Represents accretion of ARO liability. Refer to Note 23, “Asset Retirement Obligations,” beginning on page 84.
3 Includes foreign currency gains and losses, gains and losses on property dispositions, and income from operating and technical service agreements.
Supplemental Information on Oil and Gas Producing Activities