Chevron 2007 Annual Report Download - page 91
Download and view the complete annual report
Please find page 91 of the 2007 Chevron annual report below. You can navigate through the pages in the report by either clicking on the pages listed below, or by using the keyword search tool below to find specific information within the annual report.-
 1
1 -
2
-
3
-
4
-
5
-
6
-
7
-
8
-
9
-
10
-
11
-
12
-
13
-
14
-
15
-
16
-
17
-
18
-
19
-
20
-
21
-
22
-
23
-
24
-
25
-
26
-
27
-
28
-
29
-
30
-
31
-
32
-
33
-
34
-
35
-
36
-
37
-
38
-
39
-
40
-
41
-
42
-
43
-
44
-
45
-
46
-
47
-
48
-
49
-
50
-
51
-
52
-
53
-
54
-
55
-
56
-
57
-
58
-
59
-
60
-
61
-
62
-
63
-
64
-
65
-
66
-
67
-
68
-
69
-
70
-
71
-
72
-
73
-
74
-
75
-
76
-
77
-
78
-
79
-
80
-
 81
81 -
 82
82 -
 83
83 -
 84
84 -
 85
85 -
 86
86 -
 87
87 -
 88
88 -
 89
89 -
 90
90 -
 91
91 -
 92
92 -
 93
93 -
 94
94 -
 95
95 -
 96
96 -
 97
97 -
 98
98 -
 99
99 -
 100
100 -
 101
101 -
102
-
103
-
104
-
105
-
106
-
107
-
108
 |
 |

89
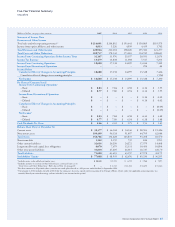
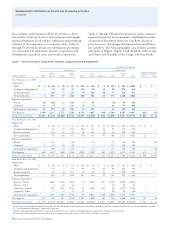
Table II – Capitalized Costs Related to Oil and Gas Producing Activities
Consolidated Companies
United States International
Gulf of Total Asia- Total Affiliated Companies
Millions of dollars Calif. Mexico Other U.S. Africa Pacific Indonesia Other Int’l. Total TCO Other
At Dec. 31, 2007
Unproved properties $ 805 $ 892 $ 353 $ 2,050 $ 314 $ 2,639 $ 630 $ 1,015 $ 4,598 $ 6,648 $ 112 $ –
Proved properties and
related producing assets 11,260 19,110 13,718 44,088 11,894 17,321 7,705 11,360 48,280 92,368 4,247 858
Support equipment 201 206 230 637 850 284 1,123 439 2,696 3,333 758 –
Deferred exploratory wells – 406 7 413 368 293 148 438 1,247 1,660 – –
Other uncompleted
projects 308 3,128 573 4,009 6,430 2,049 593 1,421 10,493 14,502 1,633 55
Gross Cap. Costs 12,574 23,742 14,881 51,197 19,856 22,586 10,199 14,673 67,314 118,511 6,750 913
Unproved properties
valuation 741 57 35 833 201 221 39 427 888 1,721 23 –
Proved producing
properties –
Depreciation and
depletion 7,383 15,074 7,640 30,097 5,427 6,912 5,592 7,062 24,993 55,090 644 167
Support equipment
depreciation 133 92 124 349 464 144 571 261 1,440 1,789 267 –
Accumulated provisions 8,257 15,223 7,799 31,279 6,092 7,277 6,202 7,750 27,321 58,600 934 167
Net Capitalized Costs $ 4,317 $ 8,519 $ 7,082 $ 19,918 $ 13,764 $ 15,309 $ 3,997 $ 6,923 $ 39,993 $ 59,911 $ 5,816 $ 746
At Dec. 31, 2006
Unproved properties $ 770 $ 1,007 $ 370 $ 2,147 $ 342 $ 2,373 $ 707 $ 1,082 $ 4,504 $ 6,651 $ 112 $ –
Proved properties and
related producing assets 9,960 18,464 12,284 40,708 9,943 15,486 7,110 10,461 43,000 83,708 2,701 1,096
Support equipment 189 212 226 627 745 240 1,093 364 2,442 3,069 611 –
Deferred exploratory wells – 343 7 350 231 217 149 292 889 1,239 – –
Other uncompleted
projects 370 2,188 – 2,558 4,299 1,546 493 917 7,255 9,813 2,493 40
Gross Cap. Costs 11,289 22,214 12,887 46,390 15,560 19,862 9,552 13,116 58,090 104,480 5,917 1,136
Unproved properties
valuation 738 52 29 819 189 74 14 337 614 1,433 22 –
Proved producing
properties –
Depreciation and
depletion 7,082 14,468 6,880 28,430 4,794 5,273 4,971 6,087 21,125 49,555 541 109
Support equipment
depreciation 125 111 130 366 400 102 522 238 1,262 1,628 242 –
Accumulated provisions 7,945 14,631 7,039 29,615 5,383 5,449 5,507 6,662 23,001 52,616 805 109
Net Capitalized Costs $ 3,344 $ 7,583 $ 5,848 $ 16,775 $ 10,177 $ 14,413 $ 4,045 $ 6,454 $ 35,089 $ 51,864 $ 5,112 $ 1,027
geographic area includes activities principally in Australia,
Azerbaijan, Bangladesh, China, Kazakhstan, Myanmar, the
Partitioned Neutral Zone between Kuwait and Saudi Arabia,
the Philippines, and Thailand. The international “Other”
geographic category includes activities in Argentina, Brazil,
Canada, Colombia, Denmark, the Netherlands, Norway,
Trinidad and Tobago, Venezuela, the United Kingdom, and
other countries. Amounts for TCO represent Chevron’s
50 percent equity share of Tengizchevroil, an exploration and
production partnership in the Republic of Kazakhstan. The
affiliated companies “Other” amounts are composed of the
company’s equity interests in Venezuela, Angola and Russia.
Refer to Note 11 beginning on page 67 for a discussion of the
company’s major equity affiliates.