Chevron 2007 Annual Report Download - page 89
Download and view the complete annual report
Please find page 89 of the 2007 Chevron annual report below. You can navigate through the pages in the report by either clicking on the pages listed below, or by using the keyword search tool below to find specific information within the annual report.-
 1
1 -
2
-
3
-
4
-
5
-
6
-
7
-
8
-
9
-
10
-
11
-
12
-
13
-
14
-
15
-
16
-
17
-
18
-
19
-
20
-
21
-
22
-
23
-
24
-
25
-
26
-
27
-
28
-
29
-
30
-
31
-
32
-
33
-
34
-
35
-
36
-
37
-
38
-
39
-
40
-
41
-
42
-
43
-
44
-
45
-
46
-
47
-
48
-
49
-
50
-
51
-
52
-
53
-
54
-
55
-
56
-
57
-
58
-
59
-
60
-
61
-
62
-
63
-
64
-
65
-
66
-
67
-
68
-
69
-
70
-
71
-
72
-
73
-
74
-
75
-
76
-
77
-
78
-
 79
79 -
 80
80 -
 81
81 -
 82
82 -
 83
83 -
 84
84 -
 85
85 -
 86
86 -
 87
87 -
 88
88 -
 89
89 -
 90
90 -
 91
91 -
 92
92 -
 93
93 -
 94
94 -
 95
95 -
 96
96 -
 97
97 -
 98
98 -
 99
99 -
100
-
101
-
102
-
103
-
104
-
105
-
106
-
107
-
108
 |
 |

87 87
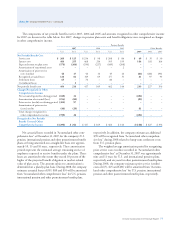
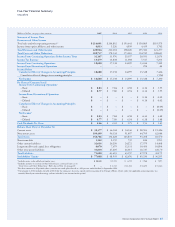
Five-Year Financial Summary
Millions of dollars, except per-share amounts 2007 2006 2005 2004 2003
Statement of Income Data
Revenues and Other Income
Total sales and other operating revenues1,2 $ 214,091 $ 204,892 $ 193,641 $ 150,865 $ 119,575
Income from equity affiliates and other income 6,813 5,226 4,559 4,435 1,702
Total Revenues and Other Income 220,904 210,118 198,200 155,300 121,277
Total Costs and Other Deductions 188,737 178,142 173,003 134,749 108,601
Income From Continuing Operations Before Income Taxes 32,167 31,976 25,197 20,551 12,676
Income Tax Expense 13,479 14,838 11,098 7,517 5,294
Income From Continuing Operations 18,688 17,138 14,099 13,034 7,382
Income From Discontinued Operations – – – 294 44
Income Before
Cumulative Effect of Changes in Accounting Principles 18,688 17,138 14,099 13,328 7,426
Cumulative effect of changes in accounting principles – – – – (196)
Net Income $ 18,688 $ 17,138 $ 14,099 $ 13,328 $ 7,230
Per Share of Common Stock3
Income From Continuing Operations4
– Basic $ 8.83 $ 7.84 $ 6.58 $ 6.16 $ 3.55
– Diluted $ 8.77 $ 7.80 $ 6.54 $ 6.14 $ 3.55
Income From Discontinued Operations
– Basic $ – $ – $ – $ 0.14 $ 0.02
– Diluted $ – $ – $ – $ 0.14 $ 0.02
Cumulative Effect of Changes in Accounting Principles
– Basic $ – $ – $ – $ – $ (0.09)
– Diluted $ – $ – $ – $ – $ (0.09)
Net Income2
– Basic $ 8.83 $ 7.84 $ 6.58 $ 6.30 $ 3.48
– Diluted $ 8.77 $ 7.80 $ 6.54 $ 6.28 $ 3.48
Cash Dividends Per Share $ 2.26 $ 2.01 $ 1.75 $ 1.53 $ 1.43
Balance Sheet Data (at December 31)
Current assets $ 39,377 $ 36,304 $ 34,336 $ 28,503 $ 19,426
Noncurrent assets 109,409 96,324 91,497 64,705 62,044
Total Assets 148,786 132,628 125,833 93,208 81,470
Short-term debt 1,162 2,159 739 816 1,703
Other current liabilities 32,636 26,250 24,272 17,979 14,408
Long-term debt and capital lease obligations 6,070 7,679 12,131 10,456 10,894
Other noncurrent liabilities 31,830 27,605 26,015 18,727 18,170
Total Liabilities 71,698 63,693 63,157 47,978 45,175
Stockholders’ Equity $ 77,088 $ 68,935 $ 62,676 $ 45,230 $ 36,295
1 Includes excise, value-added and similar taxes: $ 10,121 $ 9,551 $ 8,719 $ 7,968 $ 7,095
2 Includes amounts in revenues for buy/sell contracts; associated costs are in
“Total Costs and Other Deductions.” Refer also to Note 13, on page 69. $ – $ 6,725 $ 23,822 $ 18,650 $ 14,246
3 Per-share amounts in all periods reflect a two-for-one stock split effected as a 100 percent stock dividend in September 2004.
4 The amount in 2003 includes a benefit of $0.08 for the company’s share of a capital stock transaction of its Dynegy affiliate, which, under the applicable accounting rules, was
recorded directly to retained earnings and not included in net income for the period.