Chevron 2007 Annual Report Download - page 93
Download and view the complete annual report
Please find page 93 of the 2007 Chevron annual report below. You can navigate through the pages in the report by either clicking on the pages listed below, or by using the keyword search tool below to find specific information within the annual report.-
 1
1 -
2
-
3
-
4
-
5
-
6
-
7
-
8
-
9
-
10
-
11
-
12
-
13
-
14
-
15
-
16
-
17
-
18
-
19
-
20
-
21
-
22
-
23
-
24
-
25
-
26
-
27
-
28
-
29
-
30
-
31
-
32
-
33
-
34
-
35
-
36
-
37
-
38
-
39
-
40
-
41
-
42
-
43
-
44
-
45
-
46
-
47
-
48
-
49
-
50
-
51
-
52
-
53
-
54
-
55
-
56
-
57
-
58
-
59
-
60
-
61
-
62
-
63
-
64
-
65
-
66
-
67
-
68
-
69
-
70
-
71
-
72
-
73
-
74
-
75
-
76
-
77
-
78
-
79
-
80
-
81
-
82
-
 83
83 -
 84
84 -
 85
85 -
 86
86 -
 87
87 -
 88
88 -
 89
89 -
 90
90 -
 91
91 -
 92
92 -
 93
93 -
 94
94 -
 95
95 -
 96
96 -
 97
97 -
 98
98 -
 99
99 -
 100
100 -
 101
101 -
 102
102 -
 103
103 -
104
-
105
-
106
-
107
-
108
 |
 |

91
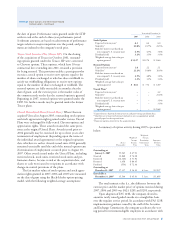
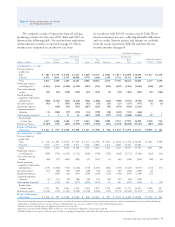
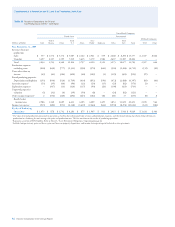
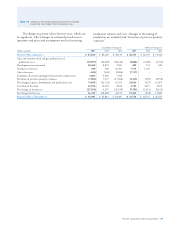
The company’s results of operations from oil and gas
producing activities for the years 2007, 2006 and 2005 are
shown in the following table. Net income from exploration
and production activities as reported on page 65 reflects
income taxes computed on an effective rate basis.
In accordance with FAS 69, income taxes in Table III are
based on statutory tax rates, reflecting allowable deductions
and tax credits. Interest income and expense are excluded
from the results reported in Table III and from the net
income amounts on page 65.
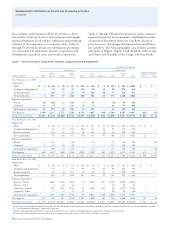
Consolidated Companies
United States International
Gulf of Total Asia- Total
Affiliated Companies
Millions of dollars Calif. Mexico Other U.S. Africa Pacific Indonesia Other Int’l. Total TCO Other
Year Ended Dec. 31, 2007
Revenues from net
production
Sales $ 202 $ 1,555 $ 2,476 $ 4,233 $ 1,810 $ 6,192 $ 1,045 $ 3,012 $ 12,059 $ 16,292 $ 3,327 $ 1,290
Transfers 4,671 2,630 2,707 10,008 6,778 4,440 2,590 2,744 16,552 26,560 – –
Total 4,873 4,185 5,183 14,241 8,588 10,632 3,635 5,756 28,611 42,852 3,327 1,290
Production expenses
excluding taxes2 (1,063) (936) (1,400) (3,399) (892) (953) (892) (828) (3,565) (6,964) (248) (92)
Taxes other than on
income (91) (53) (378) (522) (49) (292) (2) (58) (401) (923) (31) (163)
Proved producing
properties: Depreciation
and depletion (300) (1,143) (833) (2,276) (646) (1,668) (623) (980) (3,917) (6,193) (127) (94)
Accretion expense3 (92) 1 (167) (258) (33) (36) (21) (27) (117) (375) (1) (2)
Exploration expenses – (486) (25) (511) (267) (225) (61) (259) (812) (1,323) – –
Unproved properties
valuation (3) (102) (27) (132) (12) (150) (30) (120) (312) (444) – –
Other income (expense)4 3 2 31 36 (447) (302) (197) (722) (1,668) (1,632) 18 7
Results before
income taxes 3,327 1,468 2,384 7,179 6,242 7,006 1,809 2,762 17,819 24,998 2,938 946
Income tax expense (1,204) (531) (864) (2,599) (4,907) (3,456) (841) (1,624) (10,828) (13,427) (887) (462)
Results of Producing
Operations $ 2,123 $ 937 $ 1,520 $ 4,580 $ 1,335 $ 3,550 $ 968 $ 1,138 $ 6,991 $ 11,571 $ 2,051 $ 484
Year Ended Dec. 31, 2006
Revenues from net
production
Sales $ 308 $ 1,845 $ 2,976 $ 5,129 $ 2,377 $ 4,938 $ 1,001 $ 2,814 $ 11,130 $ 16,259 $ 2,861 $ 598
Transfers 4,072 2,317 2,046 8,435 5,264 4,084 2,211 2,848 14,407 22,842 – –
Total 4,380 4,162 5,022 13,564 7,641 9,022 3,212 5,662 25,537 39,101 2,861 598
Production expenses
excluding taxes (889) (765) (1,057) (2,711) (640) (740) (728) (664) (2,772) (5,483) (202) (42)
Taxes other than on
income (84) (57) (442) (583) (57) (231) (1) (60) (349) (932) (28) (6)
Proved producing
properties: Depreciation
and depletion (275) (1,096) (763) (2,134) (579) (1,475) (666) (703) (3,423) (5,557) (114) (33)
Accretion expense3 (11) (80) (39) (130) (26) (30) (23) (49) (128) (258) (1) –
Exploration expenses – (407) (24) (431) (296) (209) (110) (318) (933) (1,364) (25) –
Unproved properties
valuation (3) (73) (8) (84) (28) (15) (14) (27) (84) (168) – –
Other income (expense)4 1 (732) 254 (477) (435) (475) 50 385 (475) (952) 8 (50)
Results before
income taxes 3,119 952 2,943 7,014 5,580 5,847 1,720 4,226 17,373 24,387 2,499 467
Income tax expense (1,169) (357) (1,103) (2,629) (4,740) (3,224) (793) (2,151) (10,908) (13,537) (750) (174)
Results of Producing
Operations $ 1,950 $ 595 $ 1,840 $ 4,385 $ 840 $ 2,623 $ 927 $ 2,075 $ 6,465 $ 10,850 $ 1,749 $ 293
1 The value of owned production consumed in operations as fuel has been eliminated from revenues and production expenses, and the related volumes have been deducted from net
production in calculating the unit average sales price and production cost. This has no effect on the results of producing operations.
2 Includes $10 costs incurred prior to assignment of proved reserves in 2007.
3 Represents accretion of ARO liability. Refer to Note 23, “Asset Retirement Obligations,” beginning on page 84.
4 Includes foreign currency gains and losses, gains and losses on property dispositions, and income from operating and technical service agreements.