Chevron 2007 Annual Report Download - page 60
Download and view the complete annual report
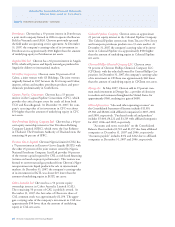
Please find page 60 of the 2007 Chevron annual report below. You can navigate through the pages in the report by either clicking on the pages listed below, or by using the keyword search tool below to find specific information within the annual report.-
 1
1 -
2
-
3
-
4
-
5
-
6
-
7
-
8
-
9
-
10
-
11
-
12
-
13
-
14
-
15
-
16
-
17
-
18
-
19
-
20
-
21
-
22
-
23
-
24
-
25
-
26
-
27
-
28
-
29
-
30
-
31
-
32
-
33
-
34
-
35
-
36
-
37
-
38
-
39
-
40
-
41
-
42
-
43
-
44
-
45
-
46
-
47
-
48
-
49
-
 50
50 -
 51
51 -
 52
52 -
 53
53 -
 54
54 -
 55
55 -
 56
56 -
 57
57 -
 58
58 -
 59
59 -
 60
60 -
 61
61 -
 62
62 -
 63
63 -
 64
64 -
 65
65 -
 66
66 -
 67
67 -
 68
68 -
 69
69 -
 70
70 -
71
-
72
-
73
-
74
-
75
-
76
-
77
-
78
-
79
-
80
-
81
-
82
-
83
-
84
-
85
-
86
-
87
-
88
-
89
-
90
-
91
-
92
-
93
-
94
-
95
-
96
-
97
-
98
-
99
-
100
-
101
-
102
-
103
-
104
-
105
-
106
-
107
-
108
 |
 |

58 58
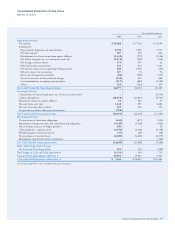
Consolidated Statement of Stockholders’ Equity
2007 2006 2005
Shares Amount Shares Amount Shares Amount
Preferred Stock – $ – – $ – – $ –
Common Stock
Balance at January 1 2,442,677 $ 1,832 2,442,677 $ 1,832 2,274,032 $ 1,706
Shares issued for Unocal acquisition – – – – 168,645 126
Balance at December 31 2,442,677 $ 1,832 2,442,677 $ 1,832 2,442,677 $ 1,832
Capital in Excess of Par
Balance at January 1 $ 14,126 $ 13,894 $ 4,160
Shares issued for Unocal acquisition – – 9,585
Treasury stock transactions 163 232 149
Balance at December 31 $ 14,289 $ 14,126 $ 13,894
Retained Earnings
Balance at January 1 $ 68,464 $ 55,738 $ 45,414
Net income 18,688 17,138 14,099
Cash dividends on common stock (4,791) (4,396) (3,778)
Adoption of EITF 04-6, “Accounting for Stripping Costs
Incurred during Production in the Mining Industry” – (19) –
Adoption of FIN 48, “Accounting for Uncertainty in Income Taxes” (35) – –
Tax benefit from dividends paid on
unallocated ESOP shares and other 3 3 3
Balance at December 31 $ 82,329 $ 68,464 $ 55,738
Notes Receivable – Key Employees $ (1) $ (2) $ (3)
Accumulated Other Comprehensive Loss
Currency translation adjustment
Balance at January 1 $ (90) $ (145) $ (140)
Change during year 31 55 (5)
Balance at December 31 $ (59) $ (90) $ (145)
Pension and other postretirement benefit plans
Balance at January 1 $ (2,585) $ (344) $ (402)
Change to defined benefit plans during year 685 (38) 58
Adoption of FAS 158, “Employers’ Accounting for
Defined Benefit Pension and Other Postretirement Plans” (108) (2,203) –
Balance at December 31 $ (2,008) $ (2,585) $ (344)
Unrealized net holding gain on securities
Balance at January 1 $ – $ 88 $ 120
Change during year 19 (88) (32)
Balance at December 31 $ 19 $ – $ 88
Net derivatives gain (loss) on hedge transactions
Balance at January 1 $ 39 $ (28) $ 103
Change during year (6) 67 (131)
Balance at December 31 $ 33 $ 39 $ (28)
Balance at December 31 $ (2,015) $ (2,636) $ (429)
Deferred Compensation and Benefit Plan Trust
Deferred Compensation
Balance at January 1 $ (214) $ (246) $ (367)
Net reduction of ESOP debt and other – 32 121
Balance at December 31 (214) (214) (246)
Benefit Plan Trust (Common Stock) 14,168 (240) 14,168 (240) 14,168 (240)
Balance at December 31 14,168 $ (454) 14,168 $ (454) 14,168 $ (486)
Treasury Stock at Cost
Balance at January 1 278,118 $ (12,395) 209,990 $ (7,870) 166,912 $ (5,124)
Purchases 85,429 (7,036) 80,369 (5,033) 52,013 (3,029)
Issuances – mainly employee benefit plans (11,304) 539 (12,241) 508 (8,935) 283
Balance at December 31 352,243 $ (18,892) 278,118 $ (12,395) 209,990 $ (7,870)
Total Stockholders’ Equity at December 31 $ 77,088 $ 68,935 $ 62,676
See accompanying Notes to the Consolidated Financial Statements.