Allstate 2015 Annual Report Download - page 90
Download and view the complete annual report
Please find page 90 of the 2015 Allstate annual report below. You can navigate through the pages in the report by either clicking on the pages listed below, or by using the keyword search tool below to find specific information within the annual report.-
 1
1 -
2
-
3
-
4
-
5
-
6
-
7
-
8
-
9
-
10
-
11
-
12
-
13
-
14
-
15
-
16
-
17
-
18
-
19
-
20
-
21
-
22
-
23
-
24
-
25
-
26
-
27
-
28
-
29
-
30
-
31
-
32
-
33
-
34
-
35
-
36
-
37
-
38
-
39
-
40
-
41
-
42
-
43
-
44
-
45
-
46
-
47
-
48
-
49
-
50
-
51
-
52
-
53
-
54
-
55
-
56
-
57
-
58
-
59
-
60
-
61
-
62
-
63
-
64
-
65
-
66
-
67
-
68
-
69
-
70
-
71
-
72
-
73
-
74
-
75
-
76
-
77
-
78
-
79
-
 80
80 -
 81
81 -
 82
82 -
 83
83 -
 84
84 -
 85
85 -
 86
86 -
 87
87 -
 88
88 -
 89
89 -
 90
90 -
 91
91 -
 92
92 -
 93
93 -
 94
94 -
 95
95 -
 96
96 -
 97
97 -
 98
98 -
 99
99 -
 100
100 -
101
-
102
-
103
-
104
-
105
-
106
-
107
-
108
-
109
-
110
-
111
-
112
-
113
-
114
-
115
-
116
-
117
-
118
-
119
-
120
-
121
-
122
-
123
-
124
-
125
-
126
-
127
-
128
-
129
-
130
-
131
-
132
-
133
-
134
-
135
-
136
-
137
-
138
-
139
-
140
-
141
-
142
-
143
-
144
-
145
-
146
-
147
-
148
-
149
-
150
-
151
-
152
-
153
-
154
-
155
-
156
-
157
-
158
-
159
-
160
-
161
-
162
-
163
-
164
-
165
-
166
-
167
-
168
-
169
-
170
-
171
-
172
-
173
-
174
-
175
-
176
-
177
-
178
-
179
-
180
-
181
-
182
-
183
-
184
-
185
-
186
-
187
-
188
-
189
-
190
-
191
-
192
-
193
-
194
-
195
-
196
-
197
-
198
-
199
-
200
-
201
-
202
-
203
-
204
-
205
-
206
-
207
-
208
-
209
-
210
-
211
-
212
-
213
-
214
-
215
-
216
-
217
-
218
-
219
-
220
-
221
-
222
-
223
-
224
-
225
-
226
-
227
-
228
-
229
-
230
-
231
-
232
-
233
-
234
-
235
-
236
-
237
-
238
-
239
-
240
-
241
-
242
-
243
-
244
-
245
-
246
-
247
-
248
-
249
-
250
-
251
-
252
-
253
-
254
-
255
-
256
-
257
-
258
-
259
-
260
-
261
-
262
-
263
-
264
-
265
-
266
-
267
-
268
-
269
-
270
-
271
-
272
 |
 |

84 www.allstate.com
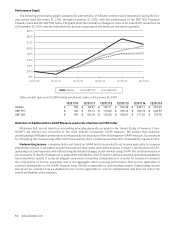
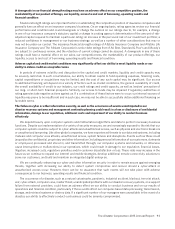
Performance Graph
The following performance graph compares the performance of Allstate common stock total return during the five-
year period from December 31, 2010, through December 31, 2015, with the performance of the S&P 500 Property/
Casualty Index and the S&P 500 Index. The graph plots the cumulative changes in value of an initial $100 investment as
of December 31, 2010, over the indicated time periods, assuming all dividends are reinvested quarterly.
$75
$100
$125
$150
$175
$200
$225
$250
$275
Allstate S&P P/C S&P 500
12/31/10 12/31/11 12/31/12 12/31/13 12/31/14
12/31/15
Value at each year-end of a $100 initial investment made on December 31, 2010
12/31/10 12/31/11 12/31/12 12/31/13 12/31/14 12/31/15
Allstate $ 100 $ 88.61 $ 132.71 $ 183.49 $ 240.11 $ 216.32
S&P P/C $ 100 $ 99.73 $ 119.68 $ 165.32 $ 190.79 $ 208.59
S&P 500 $ 100 $ 102.10 $ 118.30 $ 156.21 $ 177.32 $ 179.76
Definition of Additional Non-GAAP Measure used in the Chairman and CEO letter
Measures that are not based on accounting principles generally accepted in the United States of America (“non-
GAAP”) are defined and reconciled to the most directly comparable GAAP measure. We believe that investors’
understanding of Allstate’s performance is enhanced by our disclosure of the following non-GAAP measure. Our methods
for calculating this measure may differ from those used by other companies and therefore comparability may be limited.
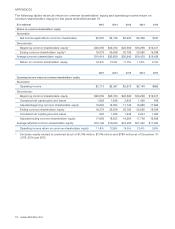
Underwriting income, a measure that is not based on GAAP and is reconciled to net income applicable to common
shareholders below, is calculated as premiums earned, less claims and claims expense (“losses”), amortization of DAC,
operating costs and expenses and restructuring and related charges, as determined using GAAP. We use this measure in
our evaluation of results of operations to analyze the profitability of the Property-Liability insurance operations separately
from investment results. It is also an integral component of incentive compensation. It is useful for investors to evaluate
the components of income separately and in the aggregate when reviewing performance. Net income applicable to
common shareholders is the GAAP measure most directly comparable to underwriting income. Underwriting income
should not be considered as a substitute for net income applicable to common shareholders and does not reflect the
overall profitability of the business.