Allstate 2015 Annual Report Download - page 228
Download and view the complete annual report
Please find page 228 of the 2015 Allstate annual report below. You can navigate through the pages in the report by either clicking on the pages listed below, or by using the keyword search tool below to find specific information within the annual report.-
 1
1 -
2
-
3
-
4
-
5
-
6
-
7
-
8
-
9
-
10
-
11
-
12
-
13
-
14
-
15
-
16
-
17
-
18
-
19
-
20
-
21
-
22
-
23
-
24
-
25
-
26
-
27
-
28
-
29
-
30
-
31
-
32
-
33
-
34
-
35
-
36
-
37
-
38
-
39
-
40
-
41
-
42
-
43
-
44
-
45
-
46
-
47
-
48
-
49
-
50
-
51
-
52
-
53
-
54
-
55
-
56
-
57
-
58
-
59
-
60
-
61
-
62
-
63
-
64
-
65
-
66
-
67
-
68
-
69
-
70
-
71
-
72
-
73
-
74
-
75
-
76
-
77
-
78
-
79
-
80
-
81
-
82
-
83
-
84
-
85
-
86
-
87
-
88
-
89
-
90
-
91
-
92
-
93
-
94
-
95
-
96
-
97
-
98
-
99
-
100
-
101
-
102
-
103
-
104
-
105
-
106
-
107
-
108
-
109
-
110
-
111
-
112
-
113
-
114
-
115
-
116
-
117
-
118
-
119
-
120
-
121
-
122
-
123
-
124
-
125
-
126
-
127
-
128
-
129
-
130
-
131
-
132
-
133
-
134
-
135
-
136
-
137
-
138
-
139
-
140
-
141
-
142
-
143
-
144
-
145
-
146
-
147
-
148
-
149
-
150
-
151
-
152
-
153
-
154
-
155
-
156
-
157
-
158
-
159
-
160
-
161
-
162
-
163
-
164
-
165
-
166
-
167
-
168
-
169
-
170
-
171
-
172
-
173
-
174
-
175
-
176
-
177
-
178
-
179
-
180
-
181
-
182
-
183
-
184
-
185
-
186
-
187
-
188
-
189
-
190
-
191
-
192
-
193
-
194
-
195
-
196
-
197
-
198
-
199
-
200
-
201
-
202
-
203
-
204
-
205
-
206
-
207
-
208
-
209
-
210
-
211
-
212
-
213
-
214
-
215
-
216
-
217
-
 218
218 -
 219
219 -
 220
220 -
 221
221 -
 222
222 -
 223
223 -
 224
224 -
 225
225 -
 226
226 -
 227
227 -
 228
228 -
 229
229 -
 230
230 -
 231
231 -
 232
232 -
 233
233 -
 234
234 -
 235
235 -
 236
236 -
 237
237 -
 238
238 -
239
-
240
-
241
-
242
-
243
-
244
-
245
-
246
-
247
-
248
-
249
-
250
-
251
-
252
-
253
-
254
-
255
-
256
-
257
-
258
-
259
-
260
-
261
-
262
-
263
-
264
-
265
-
266
-
267
-
268
-
269
-
270
-
271
-
272
 |
 |

222 www.allstate.com
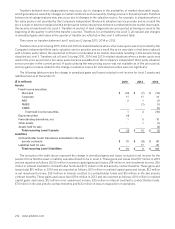
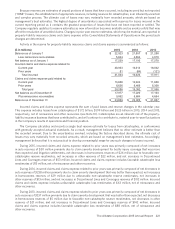
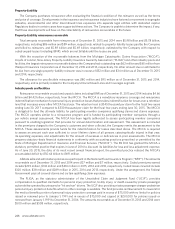
Management believes that the reserve for property-liability insurance claims and claims expense, net of reinsurance
recoverables, is appropriately established in the aggregate and adequate to cover the ultimate net cost of reported
and unreported claims arising from losses which had occurred by the date of the Consolidated Statements of Financial
Position based on available facts, technology, laws and regulations.
For further discussion of asbestos and environmental reserves, see Note14.
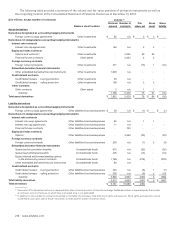
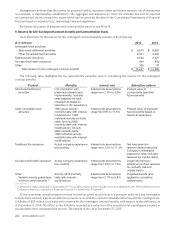
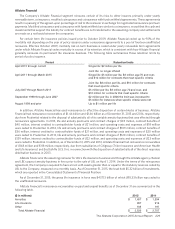
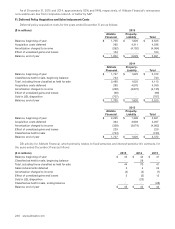
9. Reserve for Life-Contingent Contract Benefits and Contractholder Funds
As of December31, the reserve for life-contingent contract benefits consists of the following:
($ in millions) 2015 2014
Immediate fixed annuities:
Structured settlement annuities $ 6,673 $ 6,682
Other immediate fixed annuities 2,041 2,250
Traditional life insurance 2,584 2,521
Accident and health insurance 844 830
Other 105 97
Total reserve for life‑contingent contract benefits $ 12,247 $ 12,380
The following table highlights the key assumptions generally used in calculating the reserve for life-contingent
contract benefits:
Product Mortality Interest rate Estimation method
Structured settlement
annuities
U.S. population with
projected calendar year
improvements; mortality
rates adjusted for each
impaired life based on
reduction in life expectancy
Interest rate assumptions
range from 2.7% to 9.0%
Present value of
contractually specified
future benefits
Other immediate fixed
annuities
1983 group annuity
mortality table with internal
modifications; 1983
individual annuity mortality
table; Annuity 2000
mortality table with internal
modifications; Annuity
2000 mortality table;
1983 individual annuity
mortality table with internal
modifications
Interest rate assumptions
range from 0% to 11.5%
Present value of expected
future benefits based on
historical experience
Traditional life insurance Actual company experience
plus loading
Interest rate assumptions
range from 2.5% to 11.3%
Net level premium
reserve method using the
Company’s withdrawal
experience rates; includes
reserves for unpaid claims
Accident and health insurance Actual company experience
plus loading
Interest rate assumptions
range from 3.0% to 7.0%
Unearned premium;
additional contract reserves
for mortality risk and
unpaid claims
Other:
Variable annuity guaranteed
minimum death benefits (1)
Annuity 2012 mortality
table with internal
modifications
Interest rate assumptions
range from 2.1% to 5.8%
Projected benefit ratio
applied to cumulative
assessments
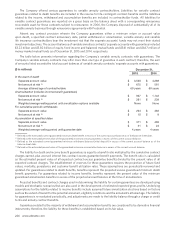
(1) In 2006, the Company disposed of substantially all of its variable annuity business through reinsurance agreements with The Prudential Insurance
Company of America, a subsidiary of Prudential Financial,Inc. (collectively “Prudential”).
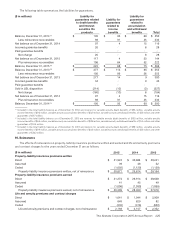
To the extent that unrealized gains on fixed income securities would result in a premium deficiency had those gains
actually been realized, a premium deficiency reserve is recorded for certain immediate annuities with life contingencies.
A liability of $28 million is included in the reserve for life-contingent contract benefits with respect to this deficiency as
of December31, 2014. The offset to this liability is recorded as a reduction of the unrealized net capital gains included in
accumulated other comprehensive income. The liability is zero as of December 31, 2015.