Allstate 2015 Annual Report Download - page 262
Download and view the complete annual report
Please find page 262 of the 2015 Allstate annual report below. You can navigate through the pages in the report by either clicking on the pages listed below, or by using the keyword search tool below to find specific information within the annual report.-
 1
1 -
2
-
3
-
4
-
5
-
6
-
7
-
8
-
9
-
10
-
11
-
12
-
13
-
14
-
15
-
16
-
17
-
18
-
19
-
20
-
21
-
22
-
23
-
24
-
25
-
26
-
27
-
28
-
29
-
30
-
31
-
32
-
33
-
34
-
35
-
36
-
37
-
38
-
39
-
40
-
41
-
42
-
43
-
44
-
45
-
46
-
47
-
48
-
49
-
50
-
51
-
52
-
53
-
54
-
55
-
56
-
57
-
58
-
59
-
60
-
61
-
62
-
63
-
64
-
65
-
66
-
67
-
68
-
69
-
70
-
71
-
72
-
73
-
74
-
75
-
76
-
77
-
78
-
79
-
80
-
81
-
82
-
83
-
84
-
85
-
86
-
87
-
88
-
89
-
90
-
91
-
92
-
93
-
94
-
95
-
96
-
97
-
98
-
99
-
100
-
101
-
102
-
103
-
104
-
105
-
106
-
107
-
108
-
109
-
110
-
111
-
112
-
113
-
114
-
115
-
116
-
117
-
118
-
119
-
120
-
121
-
122
-
123
-
124
-
125
-
126
-
127
-
128
-
129
-
130
-
131
-
132
-
133
-
134
-
135
-
136
-
137
-
138
-
139
-
140
-
141
-
142
-
143
-
144
-
145
-
146
-
147
-
148
-
149
-
150
-
151
-
152
-
153
-
154
-
155
-
156
-
157
-
158
-
159
-
160
-
161
-
162
-
163
-
164
-
165
-
166
-
167
-
168
-
169
-
170
-
171
-
172
-
173
-
174
-
175
-
176
-
177
-
178
-
179
-
180
-
181
-
182
-
183
-
184
-
185
-
186
-
187
-
188
-
189
-
190
-
191
-
192
-
193
-
194
-
195
-
196
-
197
-
198
-
199
-
200
-
201
-
202
-
203
-
204
-
205
-
206
-
207
-
208
-
209
-
210
-
211
-
212
-
213
-
214
-
215
-
216
-
217
-
218
-
219
-
220
-
221
-
222
-
223
-
224
-
225
-
226
-
227
-
228
-
229
-
230
-
231
-
232
-
233
-
234
-
235
-
236
-
237
-
238
-
239
-
240
-
241
-
242
-
243
-
244
-
245
-
246
-
247
-
248
-
249
-
250
-
251
-
 252
252 -
 253
253 -
 254
254 -
 255
255 -
 256
256 -
 257
257 -
 258
258 -
 259
259 -
 260
260 -
 261
261 -
 262
262 -
 263
263 -
 264
264 -
 265
265 -
 266
266 -
 267
267 -
 268
268 -
 269
269 -
 270
270 -
 271
271 -
 272
272
 |
 |

256 www.allstate.com
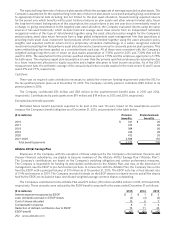
Summarized revenue data for each of the Company’s reportable segments for the years ended December31 are
as follows:
($ in millions) 2015 2014 2013
Revenues
Property-Liability
Property‑liability insurance premiums
Auto $ 20,410 $ 19,344 $ 18,449
Homeowners 7,136 6,904 6,613
Other personal lines 1,692 1,662 1,629
Commercial lines 510 476 456
Other business lines 561 542 471
Allstate Protection 30,309 28,928 27,618
Discontinued Lines and Coverages — 1 —
Total property‑liability insurance premiums 30,309 28,929 27,618
Net investment income 1,237 1,301 1,375
Realized capital gains and losses (237) 549 519
Total Property‑Liability 31,309 30,779 29,512
Allstate Financial
Life and annuity premiums and contract charges
Life and annuity premiums
Traditional life insurance 542 511 491
Immediate annuities with life contingencies — 4 37
Accident and health insurance 780 744 720
Total life and annuity premiums 1,322 1,259 1,248
Contract charges
Interest‑sensitive life insurance 822 879 1,086
Fixed annuities 14 19 18
Total contract charges 836 898 1,104
Total life and annuity premiums and contract charges 2,158 2,157 2,352
Net investment income 1,884 2,131 2,538
Realized capital gains and losses 267 144 74
Total Allstate Financial 4,309 4,432 4,964
Corporate and Other
Service fees 3 5 9
Net investment income 35 27 30
Realized capital gains and losses — 1 1
Total Corporate and Other before reclassification of service fees 38 33 40
Reclassification of service fees (1) (3) (5) (9)
Total Corporate and Other 35 28 31
Consolidated revenues $ 35,653 $ 35,239 $ 34,507
(1) For presentation in the Consolidated Statements of Operations, service fees of the Corporate and Other segment are reclassified to operating costs
and expenses.