Allstate 2015 Annual Report Download - page 102
Download and view the complete annual report
Please find page 102 of the 2015 Allstate annual report below. You can navigate through the pages in the report by either clicking on the pages listed below, or by using the keyword search tool below to find specific information within the annual report.-
 1
1 -
2
-
3
-
4
-
5
-
6
-
7
-
8
-
9
-
10
-
11
-
12
-
13
-
14
-
15
-
16
-
17
-
18
-
19
-
20
-
21
-
22
-
23
-
24
-
25
-
26
-
27
-
28
-
29
-
30
-
31
-
32
-
33
-
34
-
35
-
36
-
37
-
38
-
39
-
40
-
41
-
42
-
43
-
44
-
45
-
46
-
47
-
48
-
49
-
50
-
51
-
52
-
53
-
54
-
55
-
56
-
57
-
58
-
59
-
60
-
61
-
62
-
63
-
64
-
65
-
66
-
67
-
68
-
69
-
70
-
71
-
72
-
73
-
74
-
75
-
76
-
77
-
78
-
79
-
80
-
81
-
82
-
83
-
84
-
85
-
86
-
87
-
88
-
89
-
90
-
91
-
 92
92 -
 93
93 -
 94
94 -
 95
95 -
 96
96 -
 97
97 -
 98
98 -
 99
99 -
 100
100 -
 101
101 -
 102
102 -
 103
103 -
 104
104 -
 105
105 -
 106
106 -
 107
107 -
 108
108 -
 109
109 -
 110
110 -
 111
111 -
 112
112 -
113
-
114
-
115
-
116
-
117
-
118
-
119
-
120
-
121
-
122
-
123
-
124
-
125
-
126
-
127
-
128
-
129
-
130
-
131
-
132
-
133
-
134
-
135
-
136
-
137
-
138
-
139
-
140
-
141
-
142
-
143
-
144
-
145
-
146
-
147
-
148
-
149
-
150
-
151
-
152
-
153
-
154
-
155
-
156
-
157
-
158
-
159
-
160
-
161
-
162
-
163
-
164
-
165
-
166
-
167
-
168
-
169
-
170
-
171
-
172
-
173
-
174
-
175
-
176
-
177
-
178
-
179
-
180
-
181
-
182
-
183
-
184
-
185
-
186
-
187
-
188
-
189
-
190
-
191
-
192
-
193
-
194
-
195
-
196
-
197
-
198
-
199
-
200
-
201
-
202
-
203
-
204
-
205
-
206
-
207
-
208
-
209
-
210
-
211
-
212
-
213
-
214
-
215
-
216
-
217
-
218
-
219
-
220
-
221
-
222
-
223
-
224
-
225
-
226
-
227
-
228
-
229
-
230
-
231
-
232
-
233
-
234
-
235
-
236
-
237
-
238
-
239
-
240
-
241
-
242
-
243
-
244
-
245
-
246
-
247
-
248
-
249
-
250
-
251
-
252
-
253
-
254
-
255
-
256
-
257
-
258
-
259
-
260
-
261
-
262
-
263
-
264
-
265
-
266
-
267
-
268
-
269
-
270
-
271
-
272
 |
 |

96 www.allstate.com
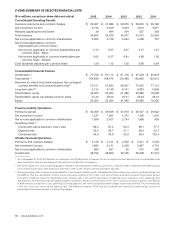
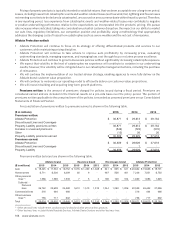
5-YEAR SUMMARY OF SELECTED FINANCIAL DATA
($ in millions, except per share data and ratios) 2015 2014 2013 2012 2011
Consolidated Operating Results
Insurance premiums and contract charges $ 32,467 $ 31,086 $ 29,970 $ 28,978 $ 28,180
Net investment income 3,156 3,459 3,943 4,010 3,971
Realized capital gains and losses 30 694 594 327 503
Total revenues 35,653 35,239 34,507 33,315 32,654
Net income applicable to common shareholders 2,055 2,746 2,263 2,306 787
Net income applicable to common
shareholders per common share:
Net income applicable to common shareholders per
common share ‑ Basic
5.12 6.37 4.87 4.71 1.51
Net income applicable to common shareholders per
common share ‑ Diluted
5.05 6.27 4.81 4.68 1.50
Cash dividends declared per common share 1.20 1.12 1.00 0.88 0.84
Consolidated Financial Position
Investments (1) $ 77,758 $ 81,113 $ 81,155 $ 97,278 $ 95,618
Total assets (2) 104,656 108,479 123,460 126,893 125,513
Reserves for claims and claims expense, life‑contingent
contract benefits and contractholder funds(1) 57,411 57,832 58,547 75,502 77,113
Long‑term debt (2) 5,124 5,140 6,141 6,003 5,858
Shareholders’ equity 20,025 22,304 21,480 20,580 18,298
Shareholders’ equity per diluted common share 47.34 48.24 45.31 42.39 36.18
Equity 20,025 22,304 21,480 20,580 18,326
Property-Liability Operations
Premiums earned $ 30,309 $ 28,929 $ 27,618 $ 26,737 $ 25,942
Net investment income 1,237 1,301 1,375 1,326 1,201
Net income applicable to common shareholders 1,690 2,427 2,754 1,968 403
Operating ratios (3)
Claims and claims expense (“loss”) ratio 69.4 67.2 64.9 69.1 77.7
Expense ratio 25.5 26.7 27.1 26.4 25.7
Combined ratio 94.9 93.9 92.0 95.5 103.4
Allstate Financial Operations
Premiums and contract charges $ 2,158 $ 2,157 $ 2,352 $ 2,241 $ 2,238
Net investment income 1,884 2,131 2,538 2,647 2,716
Net income applicable to common shareholders 663 631 95 541 590
Investments 36,792 38,809 39,105 56,999 57,373
(1) As of December31, 2013, $11.98 billion of investments and $12.84 billion of reserves for life-contingent contract benefits and contractholder funds
were classified as held for sale relating to the sale of Lincoln Benefit Life Company.
(2) Due to the adoption of new accounting guidance related to the presentation of debt issuance costs, long-term debt is reported net of debt issuance
costs. Debt issuance costs were previously reported in other assets. All prior periods have been adjusted.
(3) We use operating ratios to measure the profitability of our Property-Liability results. We believe that they enhance an investor’s understanding of our
profitability. They are calculated as follows: Claims and claims expense (“loss”) ratio is the ratio of claims and claims expense to premiums earned.
Loss ratios include the impact of catastrophe losses. Expense ratio is the ratio of amortization of deferred policy acquisition costs, operating costs
and expenses, and restructuring and related charges to premiums earned. Combined ratio is the ratio of claims and claims expense, amortization
of deferred policy acquisition costs, operating costs and expenses, and restructuring and related charges to premiums earned. The combined ratio
is the sum of the loss ratio and the expense ratio. The difference between 100% and the combined ratio represents underwriting income as a
percentage of premiums earned, or underwriting margin.