Allstate 2015 Annual Report Download - page 212
Download and view the complete annual report
Please find page 212 of the 2015 Allstate annual report below. You can navigate through the pages in the report by either clicking on the pages listed below, or by using the keyword search tool below to find specific information within the annual report.-
 1
1 -
2
-
3
-
4
-
5
-
6
-
7
-
8
-
9
-
10
-
11
-
12
-
13
-
14
-
15
-
16
-
17
-
18
-
19
-
20
-
21
-
22
-
23
-
24
-
25
-
26
-
27
-
28
-
29
-
30
-
31
-
32
-
33
-
34
-
35
-
36
-
37
-
38
-
39
-
40
-
41
-
42
-
43
-
44
-
45
-
46
-
47
-
48
-
49
-
50
-
51
-
52
-
53
-
54
-
55
-
56
-
57
-
58
-
59
-
60
-
61
-
62
-
63
-
64
-
65
-
66
-
67
-
68
-
69
-
70
-
71
-
72
-
73
-
74
-
75
-
76
-
77
-
78
-
79
-
80
-
81
-
82
-
83
-
84
-
85
-
86
-
87
-
88
-
89
-
90
-
91
-
92
-
93
-
94
-
95
-
96
-
97
-
98
-
99
-
100
-
101
-
102
-
103
-
104
-
105
-
106
-
107
-
108
-
109
-
110
-
111
-
112
-
113
-
114
-
115
-
116
-
117
-
118
-
119
-
120
-
121
-
122
-
123
-
124
-
125
-
126
-
127
-
128
-
129
-
130
-
131
-
132
-
133
-
134
-
135
-
136
-
137
-
138
-
139
-
140
-
141
-
142
-
143
-
144
-
145
-
146
-
147
-
148
-
149
-
150
-
151
-
152
-
153
-
154
-
155
-
156
-
157
-
158
-
159
-
160
-
161
-
162
-
163
-
164
-
165
-
166
-
167
-
168
-
169
-
170
-
171
-
172
-
173
-
174
-
175
-
176
-
177
-
178
-
179
-
180
-
181
-
182
-
183
-
184
-
185
-
186
-
187
-
188
-
189
-
190
-
191
-
192
-
193
-
194
-
195
-
196
-
197
-
198
-
199
-
200
-
201
-
 202
202 -
 203
203 -
 204
204 -
 205
205 -
 206
206 -
 207
207 -
 208
208 -
 209
209 -
 210
210 -
 211
211 -
 212
212 -
 213
213 -
 214
214 -
 215
215 -
 216
216 -
 217
217 -
 218
218 -
 219
219 -
 220
220 -
 221
221 -
 222
222 -
223
-
224
-
225
-
226
-
227
-
228
-
229
-
230
-
231
-
232
-
233
-
234
-
235
-
236
-
237
-
238
-
239
-
240
-
241
-
242
-
243
-
244
-
245
-
246
-
247
-
248
-
249
-
250
-
251
-
252
-
253
-
254
-
255
-
256
-
257
-
258
-
259
-
260
-
261
-
262
-
263
-
264
-
265
-
266
-
267
-
268
-
269
-
270
-
271
-
272
 |
 |

206 www.allstate.com
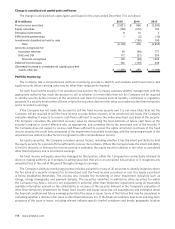
• Other investments: Certain OTC derivatives, such as interest rate caps, certain credit default swaps and certain
options (including swaptions), are valued using models that are widely accepted in the financial services
industry. These are categorized as Level 3 as a result of the significance of non-market observable inputs such
as volatility. Other primary inputs include interest rate yield curves and credit spreads.
• Contractholder funds: Derivatives embedded in certain life and annuity contracts are valued internally using
models widely accepted in the financial services industry that determine a single best estimate of fair value for
the embedded derivatives within a block of contractholder liabilities. The models primarily use stochastically
determined cash flows based on the contractual elements of embedded derivatives, projected option cost and
applicable market data, such as interest rate yield curves and equity index volatility assumptions. These are
categorized as Level 3 as a result of the significance of non-market observable inputs.
Assets and liabilities measured at fair value on a non-recurring basis
Mortgage loans written-down to fair value in connection with recognizing impairments are valued based on the fair value
of the underlying collateral less costs to sell. Limited partnership interests written-down to fair value in connection with
recognizing other-than-temporary impairments are generally valued using net asset values.
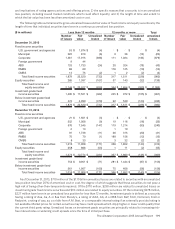
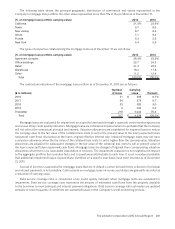
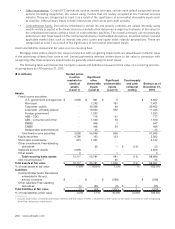
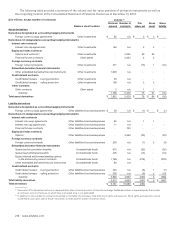
The following table summarizes the Company’s assets and liabilities measured at fair value on a recurring and non-
recurring basis as of December 31, 2015.
($ in millions) Quoted prices
in active
markets for
identical
assets
(Level 1)
Significant
other
observable
inputs
(Level 2)
Significant
unobservable
inputs
(Level 3)
Counterparty
and cash
collateral
netting
Balance as of
December 31,
2015
Assets
Fixed income securities:
U.S. government and agencies $ 3,056 $ 861 $ 5 $ 3,922
Municipal — 7,240 161 7,401
Corporate ‑ public — 30,356 46 30,402
Corporate ‑ privately placed — 10,923 502 11,425
Foreign government — 1,033 — 1,033
ABS ‑ CDO — 716 61 777
ABS ‑ consumer and other — 1,500 50 1,550
RMBS — 946 1 947
CMBS — 446 20 466
Redeemable preferred stock — 25 — 25
Total fixed income securities 3,056 54,046 846 57,948
Equity securities 4,786 163 133 5,082
Short‑term investments 615 1,507 — 2,122
Other investments: Free‑standing
derivatives — 65 1 $ (13) 53
Separate account assets 3,658 — — 3,658
Other assets 2 — 1 3
Total recurring basis assets 12,117 55,781 981 (13) 68,866
Non‑recurring basis (1) — — 55 55
Total assets at fair value $ 12,117 $ 55,781 $ 1,036 $ (13) $ 68,921
% of total assets at fair value 17.6 % 80.9% 1.5% —% 100.0%
Liabilities
Contractholder funds: Derivatives
embedded in life and
annuity contracts $ — $ — $ (299) $ (299)
Other liabilities: Free‑standing
derivatives (1) (23) (8) $ 7 (25)
Total liabilities at fair value $ (1) $ (23) $ (307) $ 7 $ (324)
% of total liabilities at fair value 0.3% 7.1% 94.8% (2.2)% 100.0%
(1) Includes $42 million of limited partnership interests and $13 million of other investments written-down to fair value in connection with recognizing
other-than-temporary impairments.