Allstate 2015 Annual Report Download - page 199
Download and view the complete annual report
Please find page 199 of the 2015 Allstate annual report below. You can navigate through the pages in the report by either clicking on the pages listed below, or by using the keyword search tool below to find specific information within the annual report.-
 1
1 -
2
-
3
-
4
-
5
-
6
-
7
-
8
-
9
-
10
-
11
-
12
-
13
-
14
-
15
-
16
-
17
-
18
-
19
-
20
-
21
-
22
-
23
-
24
-
25
-
26
-
27
-
28
-
29
-
30
-
31
-
32
-
33
-
34
-
35
-
36
-
37
-
38
-
39
-
40
-
41
-
42
-
43
-
44
-
45
-
46
-
47
-
48
-
49
-
50
-
51
-
52
-
53
-
54
-
55
-
56
-
57
-
58
-
59
-
60
-
61
-
62
-
63
-
64
-
65
-
66
-
67
-
68
-
69
-
70
-
71
-
72
-
73
-
74
-
75
-
76
-
77
-
78
-
79
-
80
-
81
-
82
-
83
-
84
-
85
-
86
-
87
-
88
-
89
-
90
-
91
-
92
-
93
-
94
-
95
-
96
-
97
-
98
-
99
-
100
-
101
-
102
-
103
-
104
-
105
-
106
-
107
-
108
-
109
-
110
-
111
-
112
-
113
-
114
-
115
-
116
-
117
-
118
-
119
-
120
-
121
-
122
-
123
-
124
-
125
-
126
-
127
-
128
-
129
-
130
-
131
-
132
-
133
-
134
-
135
-
136
-
137
-
138
-
139
-
140
-
141
-
142
-
143
-
144
-
145
-
146
-
147
-
148
-
149
-
150
-
151
-
152
-
153
-
154
-
155
-
156
-
157
-
158
-
159
-
160
-
161
-
162
-
163
-
164
-
165
-
166
-
167
-
168
-
169
-
170
-
171
-
172
-
173
-
174
-
175
-
176
-
177
-
178
-
179
-
180
-
181
-
182
-
183
-
184
-
185
-
186
-
187
-
188
-
 189
189 -
 190
190 -
 191
191 -
 192
192 -
 193
193 -
 194
194 -
 195
195 -
 196
196 -
 197
197 -
 198
198 -
 199
199 -
 200
200 -
 201
201 -
 202
202 -
 203
203 -
 204
204 -
 205
205 -
 206
206 -
 207
207 -
 208
208 -
 209
209 -
210
-
211
-
212
-
213
-
214
-
215
-
216
-
217
-
218
-
219
-
220
-
221
-
222
-
223
-
224
-
225
-
226
-
227
-
228
-
229
-
230
-
231
-
232
-
233
-
234
-
235
-
236
-
237
-
238
-
239
-
240
-
241
-
242
-
243
-
244
-
245
-
246
-
247
-
248
-
249
-
250
-
251
-
252
-
253
-
254
-
255
-
256
-
257
-
258
-
259
-
260
-
261
-
262
-
263
-
264
-
265
-
266
-
267
-
268
-
269
-
270
-
271
-
272
 |
 |

The Allstate Corporation 2015 Annual Report 193
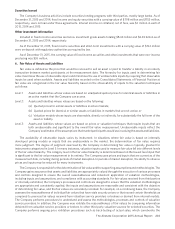
3. Disposition
On April 1, 2014, the Company sold Lincoln Benefit Life Company (“LBL”), LBL’s life insurance business generated
through independent master brokerage agencies, and all of LBL’s deferred fixed annuity and long-term care insurance
business to Resolution Life Holdings, Inc. The gross sale price was $797 million, representing $596 million of cash and
the retention of tax benefits. The loss on disposition was $698 million, pre-tax ($521 million, after-tax), and $101 million,
pre-tax ($60 million, after-tax), in 2013 and 2014, respectively. The loss on disposition in 2014 included a $22 million,
pre-tax, reduction in goodwill.
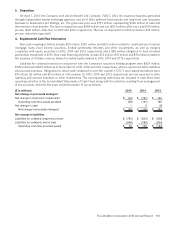
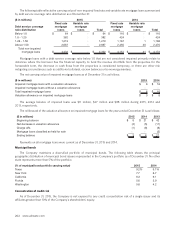
4. Supplemental Cash Flow Information
Non-cash investing activities include $131 million, $120 million and $322 million related to modifications of certain
mortgage loans, fixed income securities, limited partnership interests and other investments, as well as mergers
completed with equity securities in 2015, 2014 and 2013, respectively, and a $89 million obligation to fund a limited
partnership investment in 2015. Non-cash financing activities include $74 million, $47 million and $94 million related to
the issuance of Allstate common shares for vested equity awards in 2015, 2014 and 2013, respectively.
Liabilities for collateral received in conjunction with the Company’s securities lending program were $829 million,
$780 million and $609 million as of December 31, 2015, 2014 and 2013, respectively, and are reported in other liabilities
and accrued expenses. Obligations to return cash collateral for over-the-counter (“OTC”) and cleared derivatives were
$11 million, $2 million and $15 million as of December 31, 2015, 2014 and 2013, respectively, and are reported in other
liabilities and accrued expenses or other investments. The accompanying cash flows are included in cash flows from
operating activities in the Consolidated Statements of Cash Flows along with the activities resulting from management
of the proceeds, which for the years ended December 31 are as follows:
($ in millions) 2015 2014 2013
Net change in proceeds managed
Net change in short‑term investments $ (59) $ (167) $ 190
Operating cash flow (used) provided (59) (167) 190
Net change in cash 1 9 (6)
Net change in proceeds managed $ (58) $ (158) $ 184
Net change in liabilities
Liabilities for collateral, beginning of year $ (782) $ (624) $ (808)
Liabilities for collateral, end of year (840) (782) (624)
Operating cash flow provided (used) $ 58 $ 158 $ (184)