Allstate 2015 Annual Report Download - page 88
Download and view the complete annual report
Please find page 88 of the 2015 Allstate annual report below. You can navigate through the pages in the report by either clicking on the pages listed below, or by using the keyword search tool below to find specific information within the annual report.-
 1
1 -
2
-
3
-
4
-
5
-
6
-
7
-
8
-
9
-
10
-
11
-
12
-
13
-
14
-
15
-
16
-
17
-
18
-
19
-
20
-
21
-
22
-
23
-
24
-
25
-
26
-
27
-
28
-
29
-
30
-
31
-
32
-
33
-
34
-
35
-
36
-
37
-
38
-
39
-
40
-
41
-
42
-
43
-
44
-
45
-
46
-
47
-
48
-
49
-
50
-
51
-
52
-
53
-
54
-
55
-
56
-
57
-
58
-
59
-
60
-
61
-
62
-
63
-
64
-
65
-
66
-
67
-
68
-
69
-
70
-
71
-
72
-
73
-
74
-
75
-
76
-
77
-
 78
78 -
 79
79 -
 80
80 -
 81
81 -
 82
82 -
 83
83 -
 84
84 -
 85
85 -
 86
86 -
 87
87 -
 88
88 -
 89
89 -
 90
90 -
 91
91 -
 92
92 -
 93
93 -
 94
94 -
 95
95 -
 96
96 -
 97
97 -
 98
98 -
99
-
100
-
101
-
102
-
103
-
104
-
105
-
106
-
107
-
108
-
109
-
110
-
111
-
112
-
113
-
114
-
115
-
116
-
117
-
118
-
119
-
120
-
121
-
122
-
123
-
124
-
125
-
126
-
127
-
128
-
129
-
130
-
131
-
132
-
133
-
134
-
135
-
136
-
137
-
138
-
139
-
140
-
141
-
142
-
143
-
144
-
145
-
146
-
147
-
148
-
149
-
150
-
151
-
152
-
153
-
154
-
155
-
156
-
157
-
158
-
159
-
160
-
161
-
162
-
163
-
164
-
165
-
166
-
167
-
168
-
169
-
170
-
171
-
172
-
173
-
174
-
175
-
176
-
177
-
178
-
179
-
180
-
181
-
182
-
183
-
184
-
185
-
186
-
187
-
188
-
189
-
190
-
191
-
192
-
193
-
194
-
195
-
196
-
197
-
198
-
199
-
200
-
201
-
202
-
203
-
204
-
205
-
206
-
207
-
208
-
209
-
210
-
211
-
212
-
213
-
214
-
215
-
216
-
217
-
218
-
219
-
220
-
221
-
222
-
223
-
224
-
225
-
226
-
227
-
228
-
229
-
230
-
231
-
232
-
233
-
234
-
235
-
236
-
237
-
238
-
239
-
240
-
241
-
242
-
243
-
244
-
245
-
246
-
247
-
248
-
249
-
250
-
251
-
252
-
253
-
254
-
255
-
256
-
257
-
258
-
259
-
260
-
261
-
262
-
263
-
264
-
265
-
266
-
267
-
268
-
269
-
270
-
271
-
272
 |
 |

82 www.allstate.com
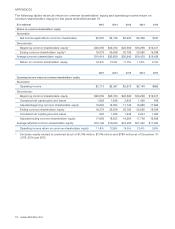
APPENDICES
The following tables reconcile return on common shareholders’ equity and operating income return on
common shareholders’ equity for the years ended December 31.
($ in millions) 2015 2014 2013 2012 2011
Return on common shareholders’ equity
Numerator:
Net income applicable to common shareholders $2,055 $2,746 $2,263 $2,306 $787
Denominator:
Beginning common shareholders’ equity(1) $20,558 $20,700 $20,580 $18,298 $18,617
Ending common shareholders’ equity(1) 18,279 20,558 20,700 20,580 18,298
Average common shareholders’ equity $19,419 $20,629 $20,640 $19,439 $18,458
Return on common shareholders’ equity 10.6% 13.3% 11.0% 11.9% 4.3%
2015 2014 2013 2012 2011
Operating income return on common shareholders’ equity
Numerator:
Operating income $2,113 $2,367 $2,670 $2,148 $662
Denominator:
Beginning common shareholders’ equity $20,558 $20,700 $20,580 $18,298 $18,617
Unrealized net capital gains and losses 1,926 1,646 2,834 1,400 948
Adjusted beginning common shareholders’ equity 18,632 19,054 17,746 16,898 17,669
Ending common shareholders’ equity 18,279 20,558 20,700 20,580 18,298
Unrealized net capital gains and losses 620 1,926 1,646 2,834 1,400
Adjusted ending common shareholders’ equity 17,659 18,632 19,054 17,746 16,898
Average adjusted common shareholders’ equity $18,146 $18,843 $18,400 $17,322 $17,284
Operating income return on common shareholders’ equity 11.6% 12.6% 14.5% 12.4% 3.8%
(1) Excludes equity related to preferred stock of $1,746 million, $1,746 million and $780 million as of December 31,
2015, 2014 and 2013.