Allstate 2015 Annual Report Download - page 112
Download and view the complete annual report
Please find page 112 of the 2015 Allstate annual report below. You can navigate through the pages in the report by either clicking on the pages listed below, or by using the keyword search tool below to find specific information within the annual report.-
 1
1 -
2
-
3
-
4
-
5
-
6
-
7
-
8
-
9
-
10
-
11
-
12
-
13
-
14
-
15
-
16
-
17
-
18
-
19
-
20
-
21
-
22
-
23
-
24
-
25
-
26
-
27
-
28
-
29
-
30
-
31
-
32
-
33
-
34
-
35
-
36
-
37
-
38
-
39
-
40
-
41
-
42
-
43
-
44
-
45
-
46
-
47
-
48
-
49
-
50
-
51
-
52
-
53
-
54
-
55
-
56
-
57
-
58
-
59
-
60
-
61
-
62
-
63
-
64
-
65
-
66
-
67
-
68
-
69
-
70
-
71
-
72
-
73
-
74
-
75
-
76
-
77
-
78
-
79
-
80
-
81
-
82
-
83
-
84
-
85
-
86
-
87
-
88
-
89
-
90
-
91
-
92
-
93
-
94
-
95
-
96
-
97
-
98
-
99
-
100
-
101
-
 102
102 -
 103
103 -
 104
104 -
 105
105 -
 106
106 -
 107
107 -
 108
108 -
 109
109 -
 110
110 -
 111
111 -
 112
112 -
 113
113 -
 114
114 -
 115
115 -
 116
116 -
 117
117 -
 118
118 -
 119
119 -
 120
120 -
 121
121 -
 122
122 -
123
-
124
-
125
-
126
-
127
-
128
-
129
-
130
-
131
-
132
-
133
-
134
-
135
-
136
-
137
-
138
-
139
-
140
-
141
-
142
-
143
-
144
-
145
-
146
-
147
-
148
-
149
-
150
-
151
-
152
-
153
-
154
-
155
-
156
-
157
-
158
-
159
-
160
-
161
-
162
-
163
-
164
-
165
-
166
-
167
-
168
-
169
-
170
-
171
-
172
-
173
-
174
-
175
-
176
-
177
-
178
-
179
-
180
-
181
-
182
-
183
-
184
-
185
-
186
-
187
-
188
-
189
-
190
-
191
-
192
-
193
-
194
-
195
-
196
-
197
-
198
-
199
-
200
-
201
-
202
-
203
-
204
-
205
-
206
-
207
-
208
-
209
-
210
-
211
-
212
-
213
-
214
-
215
-
216
-
217
-
218
-
219
-
220
-
221
-
222
-
223
-
224
-
225
-
226
-
227
-
228
-
229
-
230
-
231
-
232
-
233
-
234
-
235
-
236
-
237
-
238
-
239
-
240
-
241
-
242
-
243
-
244
-
245
-
246
-
247
-
248
-
249
-
250
-
251
-
252
-
253
-
254
-
255
-
256
-
257
-
258
-
259
-
260
-
261
-
262
-
263
-
264
-
265
-
266
-
267
-
268
-
269
-
270
-
271
-
272
 |
 |

106 www.allstate.com
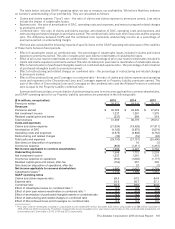
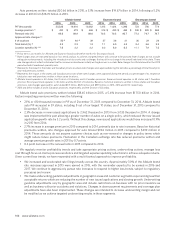
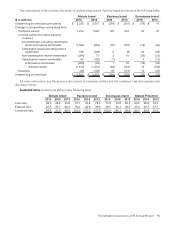
Auto premiums written totaled $20.66 billion in 2015, a 5.1% increase from $19.67 billion in 2014, following a 5.2%
increase in 2014 from $18.70 billion in 2013.
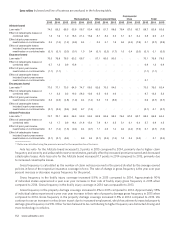
Allstate brand Esurance brand Encompass brand
2015 2014 2013 2015 2014 2013 2015 2014 2013
PIF (thousands) 20,326 19,916 19,362 1,415 1,424 1,286 723 790 774
Average premium (1) $ 492 $ 479 $ 468 $ 516 $ 499 $ 485 $ 945 $ 895 $ 880
Renewal ratio (%) 88.6 88.9 88.6 79.5 79.5 80.7 77.3 79.7 78.7
Approved rate changes (2):
# of locations 50 (6) 46 (6) 39 37 38 31 30 29 29
Total brand (%) (3) 5.3 2.3 1.9 7.1 6.0 4.8 9.4 6.6 5.9
Location specific (%) (4)(5) 7.6 3.2 3.2 9.3 6.9 6.5 11.1 7.9 7.0
(1) Policy term is six months for Allstate and Esurance brands and twelve months for Encompass brand.
(2) Rate changes that are indicated based on loss trend analysis to achieve a targeted return will continue to be pursued. Rate changes do not include
rating plan enhancements, including the introduction of discounts and surcharges that result in no change in the overall rate level in the state. These
rate changes do not reflect initial rates filed for insurance subsidiaries initially writing business in a state. Rate changes for Allstate brand for the 2013
period exclude Canada and specialty auto.
(3) Represents the impact in the states and Canadian provinces where rate changes were approved during the period as a percentage of total brand prior
year-end premiums written.
(4) Represents the impact in the states and Canadian provinces where rate changes were approved during the period as a percentage of its respective
total prior year-end premiums written in those same locations.
(5) Allstate brand operates in 50 states, the District of Columbia, and 5 Canadian provinces. Esurance brand operates in 43 states and 1 Canadian
province. Encompass brand operates in 40 states and the District of Columbia. Based on historical premiums written in those states and Canadian
provinces, rate changes approved for auto totaled $1.11 billion, $520million and $379million in 2015, 2014 and 2013, respectively.
(6) 2015 and 2014 includes 5 and 4 Canadian provinces, respectively, and the District of Columbia.
Allstate brand auto premiums written totaled $18.45 billion in 2015, a 5.4% increase from $17.50 billion in 2014.
Factors impacting premiums written were the following:
• 2.1% or 410 thousand increase in PIF as of December 31, 2015 compared to December 31, 2014. Allstate brand
auto PIF increased in 39 states, including 8 out of our largest 10 states, as of December 31, 2015 compared to
December 31, 2014.
• 2.3% decrease in new issued applications to 2,962 thousand in 2015 from 3,033thousand in 2014. A change
was implemented this year allowing a greater number of autos on a single policy, which reduced the new issued
application growth rate by 3.2 points. Without this change, new issued applications would have increased 0.9%
in 2015 from 2014.
• 2.7% increase in average premium in 2015 compared to 2014, primarily due to rate increases. Based on historical
premiums written, rate changes approved for auto totaled $942 million in 2015 compared to $399 million in
2014. These amounts do not assume customer choices such as non-renewal or changes in policy terms which
might reduce future premiums. Fluctuation in the Canadian exchange rate has reduced premiums written and
average premium growth rates in 2015 by 0.7 points.
• 0.3 point decrease in the renewal ratio in 2015 compared to 2014.
We regularly monitor profitability trends and take appropriate pricing actions, underwriting actions, manage loss
cost through focus on claims process excellence and targeted expense spending reductions to achieve adequate returns.
Given current loss trends, we have responded with a multi-faceted approach to improve profitability.
• We increased and accelerated rate filings broadly across the country. Approximately 30% of the Allstate brand
rate increases approved in 2015 were earned in 2015, with the remainder expected to be earned in 2016 and
2017. We continue to aggressively pursue rate increases to respond to higher loss trends, subject to regulatory
processes and review.
• We made underwriting guideline adjustments in geographic areas and customer segments experiencing less than
acceptable returns which are reducing the number of new issued applications and slowing growth. Underwriting
guideline adjustments vary by geographic area and include restrictions on business with no prior insurance as
well as business with prior accidents and violations. Changes in down payment requirements and coverage plan
adjustments have also been implemented. These changes are intended to increase underwriting margin and can
be modified as we achieve targeted underwriting results in these segments.