Allstate 2015 Annual Report Download - page 118
Download and view the complete annual report
Please find page 118 of the 2015 Allstate annual report below. You can navigate through the pages in the report by either clicking on the pages listed below, or by using the keyword search tool below to find specific information within the annual report.-
 1
1 -
2
-
3
-
4
-
5
-
6
-
7
-
8
-
9
-
10
-
11
-
12
-
13
-
14
-
15
-
16
-
17
-
18
-
19
-
20
-
21
-
22
-
23
-
24
-
25
-
26
-
27
-
28
-
29
-
30
-
31
-
32
-
33
-
34
-
35
-
36
-
37
-
38
-
39
-
40
-
41
-
42
-
43
-
44
-
45
-
46
-
47
-
48
-
49
-
50
-
51
-
52
-
53
-
54
-
55
-
56
-
57
-
58
-
59
-
60
-
61
-
62
-
63
-
64
-
65
-
66
-
67
-
68
-
69
-
70
-
71
-
72
-
73
-
74
-
75
-
76
-
77
-
78
-
79
-
80
-
81
-
82
-
83
-
84
-
85
-
86
-
87
-
88
-
89
-
90
-
91
-
92
-
93
-
94
-
95
-
96
-
97
-
98
-
99
-
100
-
101
-
102
-
103
-
104
-
105
-
106
-
107
-
 108
108 -
 109
109 -
 110
110 -
 111
111 -
 112
112 -
 113
113 -
 114
114 -
 115
115 -
 116
116 -
 117
117 -
 118
118 -
 119
119 -
 120
120 -
 121
121 -
 122
122 -
 123
123 -
 124
124 -
 125
125 -
 126
126 -
 127
127 -
 128
128 -
129
-
130
-
131
-
132
-
133
-
134
-
135
-
136
-
137
-
138
-
139
-
140
-
141
-
142
-
143
-
144
-
145
-
146
-
147
-
148
-
149
-
150
-
151
-
152
-
153
-
154
-
155
-
156
-
157
-
158
-
159
-
160
-
161
-
162
-
163
-
164
-
165
-
166
-
167
-
168
-
169
-
170
-
171
-
172
-
173
-
174
-
175
-
176
-
177
-
178
-
179
-
180
-
181
-
182
-
183
-
184
-
185
-
186
-
187
-
188
-
189
-
190
-
191
-
192
-
193
-
194
-
195
-
196
-
197
-
198
-
199
-
200
-
201
-
202
-
203
-
204
-
205
-
206
-
207
-
208
-
209
-
210
-
211
-
212
-
213
-
214
-
215
-
216
-
217
-
218
-
219
-
220
-
221
-
222
-
223
-
224
-
225
-
226
-
227
-
228
-
229
-
230
-
231
-
232
-
233
-
234
-
235
-
236
-
237
-
238
-
239
-
240
-
241
-
242
-
243
-
244
-
245
-
246
-
247
-
248
-
249
-
250
-
251
-
252
-
253
-
254
-
255
-
256
-
257
-
258
-
259
-
260
-
261
-
262
-
263
-
264
-
265
-
266
-
267
-
268
-
269
-
270
-
271
-
272
 |
 |

112 www.allstate.com
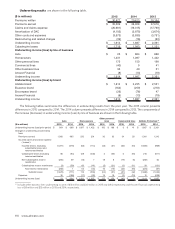
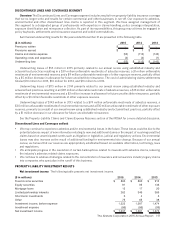
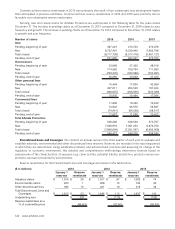
Loss ratios by brand and line of business are analyzed in the following table.
Auto Homeowners Other personal lines
Commercial
lines Total
2015 2014 2013 2015 2014 2013 2015 2014 2013 2015 2014 2013 2015 2014 2013
Allstate brand
Loss ratio (1) 74.5 69.2 68.5 55.6 58.7 53.4 60.9 61.7 58.6 78.4 67.0 60.7 68.7 65.8 63.6
Effect of catastrophe losses on
combined ratio 1.3 1.6 1.0 18.3 21.4 15.6 8.1 8.2 3.5 5.1 6.1 0.4 5.8 6.9 4.7
Effect of prior year reserve
reestimates on combined ratio 0.2 (1.2) (1.2) (0.3) 0.4 — 0.5 2.1 1.8 0.4 (4.2) (7.9) 0.1 (0.7) (0.9)
Effect of catastrophe losses
included in prior year reserve
reestimates on combined ratio (0.1) (0.1) (0.3) (0.1) 1.0 0.4 (0.1) (0.2) (1.7) 1.0 0.4 (2.0) (0.1) 0.1 (0.3)
Esurance brand
Loss ratio (1) 75.3 76.8 78.5 63.2 66.7 — 57.1 60.0 50.0 — — — 75.1 76.8 78.5
Effect of catastrophe losses on
combined ratio 0.7 1.3 0.9 15.8 — — — — — — — — 0.9 1.3 0.9
Effect of prior year reserve
reestimates on combined ratio (1.1) (1.1) — — — — — — — — — — (1.1) (1.1) —
Effect of catastrophe losses
included in prior year reserve
reestimates on combined ratio — — — — — — — — — — — — 0.1 — —
Encompass brand
Loss ratio (1) 77.0 77.1 73.5 64.9 74.7 56.3 92.6 75.5 54.0 — — — 73.5 76.0 65.4
Effect of catastrophe losses on
combined ratio 1.1 3.2 0.3 19.3 28.2 12.6 6.5 6.6 4.0 — — — 8.7 13.2 5.2
Effect of prior year reserve
reestimates on combined ratio 0.3 (2.0) (4.8) (1.0) 0.4 (1.2) 9.3 1.9 (8.0) — — — 0.6 (0.7) (3.7)
Effect of catastrophe losses
included in prior year reserve
reestimates on combined ratio (0.1) (0.2) (0.5) (0.2) 0.7 (1.3) — — — — — — (0.1) 0.1 (0.7)
Allstate Protection
Loss ratio (1) 74.7 70.1 69.3 56.3 59.9 53.5 62.9 62.6 58.2 78.4 67.0 60.7 69.2 66.8 64.4
Effect of catastrophe losses on
combined ratio 1.2 1.7 0.9 18.4 21.8 15.4 7.9 8.1 3.5 5.1 6.1 0.4 5.7 6.9 4.5
Effect of prior year reserve
reestimates on combined ratio 0.1 (1.2) (1.3) (0.4) 0.4 (0.1) 1.1 2.0 1.2 0.4 (4.2) (7.9) 0.1 (0.7) (1.0)
Effect of catastrophe losses
included in prior year reserve
reestimates on combined ratio (0.1) (0.1) (0.4) — 0.9 0.3 (0.1) (0.3) (1.5) 1.0 0.4 (2.0) — 0.1 (0.3)
(1) Ratios are calculated using the premiums earned for the respective line of business.
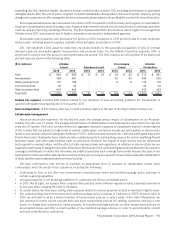
Auto loss ratio for the Allstate brand increased 5.3 points in 2015 compared to 2014, primarily due to higher claim
frequency and severity and unfavorable reserve reestimates, partially offset by increased premiums earned and decreased
catastrophe losses. Auto loss ratio for the Allstate brand increased 0.7 points in 2014 compared to 2013, primarily due
to increased catastrophe losses.
Gross frequency is calculated as the number of claim notices received in the period divided by the average earned
policies in force of the respective insurance coverage in force. The rate of change in gross frequency is the year over year
percent increase or decrease in gross frequency for the period.
Gross frequency in the bodily injury coverage increased 5.9% in 2015 compared to 2014. Approximately 90%
of individual states experienced a year over year increase in their rate of bodily injury gross frequency in 2015 when
compared to 2014. Gross frequency in the bodily injury coverage in 2014 was comparable to 2013.
Gross frequency in the property damage coverage increased 6.3% in 2015 compared to 2014. Approximately 95%
of individual states experienced a year over year increase in their rate of property damage gross frequency in 2015 when
compared to 2014. Gross frequency in the property damage coverage increased 0.5% in 2014 compared to 2013. We
continue to see an increase in miles driven in part due to increased employment, which has adversely impacted property
damage gross frequency in 2015. Other factors believed to be contributing to higher frequency are distracted driving and
more technology in vehicles.