Allstate 2015 Annual Report Download - page 255
Download and view the complete annual report
Please find page 255 of the 2015 Allstate annual report below. You can navigate through the pages in the report by either clicking on the pages listed below, or by using the keyword search tool below to find specific information within the annual report.-
 1
1 -
2
-
3
-
4
-
5
-
6
-
7
-
8
-
9
-
10
-
11
-
12
-
13
-
14
-
15
-
16
-
17
-
18
-
19
-
20
-
21
-
22
-
23
-
24
-
25
-
26
-
27
-
28
-
29
-
30
-
31
-
32
-
33
-
34
-
35
-
36
-
37
-
38
-
39
-
40
-
41
-
42
-
43
-
44
-
45
-
46
-
47
-
48
-
49
-
50
-
51
-
52
-
53
-
54
-
55
-
56
-
57
-
58
-
59
-
60
-
61
-
62
-
63
-
64
-
65
-
66
-
67
-
68
-
69
-
70
-
71
-
72
-
73
-
74
-
75
-
76
-
77
-
78
-
79
-
80
-
81
-
82
-
83
-
84
-
85
-
86
-
87
-
88
-
89
-
90
-
91
-
92
-
93
-
94
-
95
-
96
-
97
-
98
-
99
-
100
-
101
-
102
-
103
-
104
-
105
-
106
-
107
-
108
-
109
-
110
-
111
-
112
-
113
-
114
-
115
-
116
-
117
-
118
-
119
-
120
-
121
-
122
-
123
-
124
-
125
-
126
-
127
-
128
-
129
-
130
-
131
-
132
-
133
-
134
-
135
-
136
-
137
-
138
-
139
-
140
-
141
-
142
-
143
-
144
-
145
-
146
-
147
-
148
-
149
-
150
-
151
-
152
-
153
-
154
-
155
-
156
-
157
-
158
-
159
-
160
-
161
-
162
-
163
-
164
-
165
-
166
-
167
-
168
-
169
-
170
-
171
-
172
-
173
-
174
-
175
-
176
-
177
-
178
-
179
-
180
-
181
-
182
-
183
-
184
-
185
-
186
-
187
-
188
-
189
-
190
-
191
-
192
-
193
-
194
-
195
-
196
-
197
-
198
-
199
-
200
-
201
-
202
-
203
-
204
-
205
-
206
-
207
-
208
-
209
-
210
-
211
-
212
-
213
-
214
-
215
-
216
-
217
-
218
-
219
-
220
-
221
-
222
-
223
-
224
-
225
-
226
-
227
-
228
-
229
-
230
-
231
-
232
-
233
-
234
-
235
-
236
-
237
-
238
-
239
-
240
-
241
-
242
-
243
-
244
-
 245
245 -
 246
246 -
 247
247 -
 248
248 -
 249
249 -
 250
250 -
 251
251 -
 252
252 -
 253
253 -
 254
254 -
 255
255 -
 256
256 -
 257
257 -
 258
258 -
 259
259 -
 260
260 -
 261
261 -
 262
262 -
 263
263 -
 264
264 -
 265
265 -
266
-
267
-
268
-
269
-
270
-
271
-
272
 |
 |

The Allstate Corporation 2015 Annual Report 249
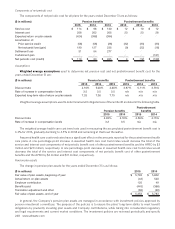
target plan asset allocation by asset category. In addition, the policies specify various asset allocation and other risk
limits. The target asset allocation takes the plans’ funding status into consideration, among other factors, including
anticipated demographic changes or liquidity requirements that may affect the funding status such as the potential
impact of lump sum settlements as well as existing or expected market conditions. In general, the allocation has a lower
overall investment risk when a plan is in a stronger funded status position since there is less economic incentive to take
risk to increase the expected returns on the plan assets. As a result, the primary employee plan has a greater allocation
to equity securities than the employee-agent plan. The primary qualified employee plan comprises 80% of total plan
assets and 86% of equity securities. The pension plans’ asset exposure within each asset category is tracked against
widely accepted established benchmarks for each asset class with limits on variation from the benchmark established in
the investment policy. Pension plan assets are regularly monitored for compliance with these limits and other risk limits
specified in the investment policies.
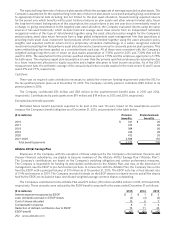
The pension plans’ weighted average target asset allocation and the actual percentage of plan assets, by asset
category as of December31, 2015 are as follows:
Target asset
allocation (1)
Actual percentage
of plan assets
Asset category 2015 2015 2014
Equity securities (2) 53 ‑ 63% 60% 41%
Fixed income securities 28 ‑ 37% 30 50
Limited partnership interests 0 ‑ 12% 7 7
Short‑term investments and other — 3 2
Total without securities lending (3) 100% 100%
(1) The target asset allocation considers risk based exposure while the actual percentage of plan assets utilizes a financial reporting view excluding
exposure provided through derivatives.
(2) The actual percentage of plan assets for equity securities include private equity investments that are subject to the limited partnership interests
target allocation of 2% and 1% in 2015 and 2014, respectively, fixed income mutual funds that are subject to the fixed income securities target
allocation of 3% for both 2015 and 2014 as well as 9% of equity exposure created through a derivative which is not included in the actual allocations
in 2014.
(3) Securities lending collateral reinvestment of $152 million and $217 million is excluded from the table above in 2015 and 2014, respectively.
The target asset allocation for an asset category may be achieved either through direct investment holdings, through
replication using derivative instruments (e.g.,futures or swaps) or net of hedges using derivative instruments to reduce
exposure to an asset category. The net notional amount of derivatives used for replication and hedges is limited to 105%
or 115% of total plan assets depending on the plan. Market performance of the different asset categories may, from time
to time, cause deviation from the target asset allocation. The asset allocation mix is reviewed on a periodic basis and
rebalanced to bring the allocation within the target ranges.
Outside the target asset allocation, the pension plans participate in a securities lending program to enhance returns.
As of December 31, 2015, U.S. government fixed income securities and U.S. equity securities are lent out and cash
collateral is invested 5% in fixed income securities and 95% in short-term investments.