Allstate 2015 Annual Report Download - page 87
Download and view the complete annual report
Please find page 87 of the 2015 Allstate annual report below. You can navigate through the pages in the report by either clicking on the pages listed below, or by using the keyword search tool below to find specific information within the annual report.-
 1
1 -
2
-
3
-
4
-
5
-
6
-
7
-
8
-
9
-
10
-
11
-
12
-
13
-
14
-
15
-
16
-
17
-
18
-
19
-
20
-
21
-
22
-
23
-
24
-
25
-
26
-
27
-
28
-
29
-
30
-
31
-
32
-
33
-
34
-
35
-
36
-
37
-
38
-
39
-
40
-
41
-
42
-
43
-
44
-
45
-
46
-
47
-
48
-
49
-
50
-
51
-
52
-
53
-
54
-
55
-
56
-
57
-
58
-
59
-
60
-
61
-
62
-
63
-
64
-
65
-
66
-
67
-
68
-
69
-
70
-
71
-
72
-
73
-
74
-
75
-
76
-
 77
77 -
 78
78 -
 79
79 -
 80
80 -
 81
81 -
 82
82 -
 83
83 -
 84
84 -
 85
85 -
 86
86 -
 87
87 -
 88
88 -
 89
89 -
 90
90 -
 91
91 -
 92
92 -
 93
93 -
 94
94 -
 95
95 -
 96
96 -
 97
97 -
98
-
99
-
100
-
101
-
102
-
103
-
104
-
105
-
106
-
107
-
108
-
109
-
110
-
111
-
112
-
113
-
114
-
115
-
116
-
117
-
118
-
119
-
120
-
121
-
122
-
123
-
124
-
125
-
126
-
127
-
128
-
129
-
130
-
131
-
132
-
133
-
134
-
135
-
136
-
137
-
138
-
139
-
140
-
141
-
142
-
143
-
144
-
145
-
146
-
147
-
148
-
149
-
150
-
151
-
152
-
153
-
154
-
155
-
156
-
157
-
158
-
159
-
160
-
161
-
162
-
163
-
164
-
165
-
166
-
167
-
168
-
169
-
170
-
171
-
172
-
173
-
174
-
175
-
176
-
177
-
178
-
179
-
180
-
181
-
182
-
183
-
184
-
185
-
186
-
187
-
188
-
189
-
190
-
191
-
192
-
193
-
194
-
195
-
196
-
197
-
198
-
199
-
200
-
201
-
202
-
203
-
204
-
205
-
206
-
207
-
208
-
209
-
210
-
211
-
212
-
213
-
214
-
215
-
216
-
217
-
218
-
219
-
220
-
221
-
222
-
223
-
224
-
225
-
226
-
227
-
228
-
229
-
230
-
231
-
232
-
233
-
234
-
235
-
236
-
237
-
238
-
239
-
240
-
241
-
242
-
243
-
244
-
245
-
246
-
247
-
248
-
249
-
250
-
251
-
252
-
253
-
254
-
255
-
256
-
257
-
258
-
259
-
260
-
261
-
262
-
263
-
264
-
265
-
266
-
267
-
268
-
269
-
270
-
271
-
272
 |
 |

The Allstate Corporation 2016 Proxy Statement 81
APPENDICES
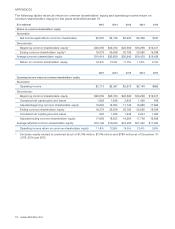
The following table reconciles the Property-Liability underlying combined ratio to the Property-Liability
combined ratio.
Twelve months ended
December 31,
2015 2014 2013 2012 2011
Combined ratio excluding the effect of catastrophes, prior
year reserve reestimates and amortization of purchased
intangible assets (“underlying combined ratio”) 88.7 87.2 87.3 87.2 89.3
Effect of catastrophe losses 5.7 6.9 4.5 8.8 14.7
Effect of prior year non‑catastrophe reserve reestimates 0.3 (0.4) (0.1) (1.0) (0.8)
Effect of amortization of purchased intangible assets 0.2 0.2 0.3 0.5 0.2
Combined ratio (“recorded combined ratio”) 94.9 93.9 92.0 95.5 103.4
Effect of prior year catastrophe reserve reestimates — 0.1 (0.3) (1.5) (0.5)
Underwriting margin is calculated as 100% minus the combined ratio.
Operating income return on common shareholders’
equity is a ratio that uses a non-GAAP measure.
It is calculated by dividing the rolling 12-month
operating income by the average of common
shareholders’ equity at the beginning and at the
end of the 12-months, after excluding the effect of
unrealized net capital gains and losses. Return on
common shareholders’ equity is the most directly
comparable GAAP measure. We use operating
income as the numerator for the same reasons we
use operating income, as discussed above. We use
average common shareholders’ equity excluding
the effect of unrealized net capital gains and losses
for the denominator as a representation of common
shareholders’ equity primarily attributable to the
company’s earned and realized business operations
because it eliminates the effect of items that are
unrealized and vary significantly between periods
due to external economic developments such as
capital market conditions like changes in equity
prices and interest rates, the amount and timing of
which are unrelated to the insurance underwriting
process. We use it to supplement our evaluation of
net income applicable to common shareholders and
return on common shareholders’ equity because it
excludes the effect of items that tend to be highly
variable from period to period. We believe that this
measure is useful to investors and that it provides
a valuable tool for investors when considered
along with return on common shareholders’ equity
because it eliminates the after-tax effects of realized
and unrealized net capital gains and losses that
can fluctuate significantly from period to period
and that are driven by economic developments, the
magnitude and timing of which are generally not
influenced by management. In addition, it eliminates
non-recurring items that are not indicative of our
ongoing business or economic trends. A byproduct
of excluding the items noted above to determine
operating income return on common shareholders’
equity from return on common shareholders’ equity
is the transparency and understanding of their
significance to return on common shareholders’
equity variability and profitability while recognizing
these or similar items may recur in subsequent
periods. We use adjusted measures of operating
income return on common shareholders’ equity
in incentive compensation. Therefore, we believe
it is useful for investors to have operating income
return on common shareholders’ equity and return
on common shareholders’ equity when evaluating
our performance. We note that investors, financial
analysts, financial and business media organizations
and rating agencies utilize operating income
return on common shareholders’ equity results in
their evaluation of our and our industry’s financial
performance and in their investment decisions,
recommendations and communications as it
represents a reliable, representative and consistent
measurement of the industry and the company
and management’s utilization of capital. Operating
income return on common shareholders’ equity
should not be considered a substitute for return on
common shareholders’ equity and does not reflect
the overall profitability of our business.