Allstate 2015 Annual Report Download - page 49
Download and view the complete annual report
Please find page 49 of the 2015 Allstate annual report below. You can navigate through the pages in the report by either clicking on the pages listed below, or by using the keyword search tool below to find specific information within the annual report.-
 1
1 -
2
-
3
-
4
-
5
-
6
-
7
-
8
-
9
-
10
-
11
-
12
-
13
-
14
-
15
-
16
-
17
-
18
-
19
-
20
-
21
-
22
-
23
-
24
-
25
-
26
-
27
-
28
-
29
-
30
-
31
-
32
-
33
-
34
-
35
-
36
-
37
-
38
-
 39
39 -
 40
40 -
 41
41 -
 42
42 -
 43
43 -
 44
44 -
 45
45 -
 46
46 -
 47
47 -
 48
48 -
 49
49 -
 50
50 -
 51
51 -
 52
52 -
 53
53 -
 54
54 -
 55
55 -
 56
56 -
 57
57 -
 58
58 -
 59
59 -
60
-
61
-
62
-
63
-
64
-
65
-
66
-
67
-
68
-
69
-
70
-
71
-
72
-
73
-
74
-
75
-
76
-
77
-
78
-
79
-
80
-
81
-
82
-
83
-
84
-
85
-
86
-
87
-
88
-
89
-
90
-
91
-
92
-
93
-
94
-
95
-
96
-
97
-
98
-
99
-
100
-
101
-
102
-
103
-
104
-
105
-
106
-
107
-
108
-
109
-
110
-
111
-
112
-
113
-
114
-
115
-
116
-
117
-
118
-
119
-
120
-
121
-
122
-
123
-
124
-
125
-
126
-
127
-
128
-
129
-
130
-
131
-
132
-
133
-
134
-
135
-
136
-
137
-
138
-
139
-
140
-
141
-
142
-
143
-
144
-
145
-
146
-
147
-
148
-
149
-
150
-
151
-
152
-
153
-
154
-
155
-
156
-
157
-
158
-
159
-
160
-
161
-
162
-
163
-
164
-
165
-
166
-
167
-
168
-
169
-
170
-
171
-
172
-
173
-
174
-
175
-
176
-
177
-
178
-
179
-
180
-
181
-
182
-
183
-
184
-
185
-
186
-
187
-
188
-
189
-
190
-
191
-
192
-
193
-
194
-
195
-
196
-
197
-
198
-
199
-
200
-
201
-
202
-
203
-
204
-
205
-
206
-
207
-
208
-
209
-
210
-
211
-
212
-
213
-
214
-
215
-
216
-
217
-
218
-
219
-
220
-
221
-
222
-
223
-
224
-
225
-
226
-
227
-
228
-
229
-
230
-
231
-
232
-
233
-
234
-
235
-
236
-
237
-
238
-
239
-
240
-
241
-
242
-
243
-
244
-
245
-
246
-
247
-
248
-
249
-
250
-
251
-
252
-
253
-
254
-
255
-
256
-
257
-
258
-
259
-
260
-
261
-
262
-
263
-
264
-
265
-
266
-
267
-
268
-
269
-
270
-
271
-
272
 |
 |

The Allstate Corporation 2016 Proxy Statement 43
EXECUTIVE COMPENSATION
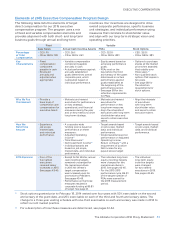
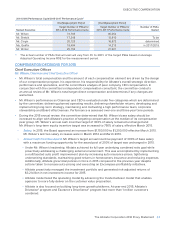
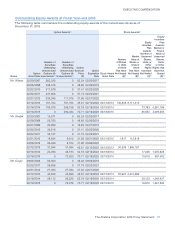
2014-2016 Performance Cycle/2015-2017 Performance Cycle(1)
One Measurement Period One Measurement Period
Named Executive
Target Number of PSAs for
2014-2016 Performance Cycle
Target Number of PSAs for
2015-2017 Performance Cycle
Number of PSAs
Vested
Mr. Wilson 73,783 65,054
Mr. Shebik 17,248 15,910 To be
Mr. Civgin 20,123 16,872 determined
Ms. Greffin 18,494 14,213 in 2017/2018
Mr. Winter 25,153 21,921
(1) The actual number of PSAs that will vest will vary from 0% to 200% of the target PSAs based on Average
Adjusted Operating Income ROE for the measurement period.
COMPENSATION DECISIONS FOR 2015
Chief Executive Officer
Mr. Wilson, Chairman and Chief Executive Officer
• Mr.Wilson’s total compensation and the amount of each compensation element are driven by the design
of our compensation program, his experience, his responsibility for Allstate’s overall strategic direction,
performance and operations, and the committee’s analysis of peer company CEO compensation. In
conjunction with the committee’s independent compensation consultant, the committee conducts
an annual review of Mr.Wilson’s total target direct compensation and determines if any changes are
warranted.
• Mr.Wilson’s performance as Chairman and CEO is evaluated under five categories which are determined
by the committee: delivering planned operating results, delivering shareholder returns, developing and
implementing long-term strategy, maintaining and motivating a high performance team, corporate
stewardship and Board effectiveness. Performance is assessed over one and three year time periods.
• During the 2015 annual review, the committee determined that Mr.Wilson’s base salary should be
increased to align with Allstate’s practice of targeting compensation at the median of its compensation
peer group. Mr.Wilson’s annual cash incentive target of 300% of salary remained unchanged and
Mr. Wilson’s long-term equity incentive target was increased to 750% of salary, effective March 2015.
• Salary. In 2015, the Board approved an increase from $1,150,000 to $1,200,000 effective March 2015.
Mr.Wilson’s last two salary increases were in March 2014 and March 2010.
• Annual Cash Incentive Award. Mr.Wilson’s target annual incentive payment of 300% of base salary
with a maximum funding opportunity for the award pool of 200% of target was unchanged in 2015.
• Under Mr. Wilson’s leadership, Allstate achieved its full year underlying combined ratio goal while
proactively addressing a challenging external environment. This was accomplished by implementing
a multifaceted auto profit improvement plan by increasing auto insurance prices, tightening
underwriting standards, maintaining good returns in homeowners insurance and reducing expenses.
Additionally, Allstate grew total policies in force in 2015 compared to the previous year despite
actions taken to increase auto pricing and executing on Encompass profitability initiatives.
• Allstate proactively managed the investment portfolio and generated risk-adjusted returns of
$3.2 billion in net investment income for 2015.
• Allstate modernized the operating model by advancing the trusted advisor model that enables
agencies to more fully deliver on the customer value proposition.
• Allstate is also focused on building long-term growth platforms. At year-end 2015, Allstate’s
Drivewise® program and Esurance’s DriveSense® program had more than 1 million customers
combined.