Allstate 2015 Annual Report Download - page 150
Download and view the complete annual report
Please find page 150 of the 2015 Allstate annual report below. You can navigate through the pages in the report by either clicking on the pages listed below, or by using the keyword search tool below to find specific information within the annual report.-
 1
1 -
2
-
3
-
4
-
5
-
6
-
7
-
8
-
9
-
10
-
11
-
12
-
13
-
14
-
15
-
16
-
17
-
18
-
19
-
20
-
21
-
22
-
23
-
24
-
25
-
26
-
27
-
28
-
29
-
30
-
31
-
32
-
33
-
34
-
35
-
36
-
37
-
38
-
39
-
40
-
41
-
42
-
43
-
44
-
45
-
46
-
47
-
48
-
49
-
50
-
51
-
52
-
53
-
54
-
55
-
56
-
57
-
58
-
59
-
60
-
61
-
62
-
63
-
64
-
65
-
66
-
67
-
68
-
69
-
70
-
71
-
72
-
73
-
74
-
75
-
76
-
77
-
78
-
79
-
80
-
81
-
82
-
83
-
84
-
85
-
86
-
87
-
88
-
89
-
90
-
91
-
92
-
93
-
94
-
95
-
96
-
97
-
98
-
99
-
100
-
101
-
102
-
103
-
104
-
105
-
106
-
107
-
108
-
109
-
110
-
111
-
112
-
113
-
114
-
115
-
116
-
117
-
118
-
119
-
120
-
121
-
122
-
123
-
124
-
125
-
126
-
127
-
128
-
129
-
130
-
131
-
132
-
133
-
134
-
135
-
136
-
137
-
138
-
139
-
 140
140 -
 141
141 -
 142
142 -
 143
143 -
 144
144 -
 145
145 -
 146
146 -
 147
147 -
 148
148 -
 149
149 -
 150
150 -
 151
151 -
 152
152 -
 153
153 -
 154
154 -
 155
155 -
 156
156 -
 157
157 -
 158
158 -
 159
159 -
 160
160 -
161
-
162
-
163
-
164
-
165
-
166
-
167
-
168
-
169
-
170
-
171
-
172
-
173
-
174
-
175
-
176
-
177
-
178
-
179
-
180
-
181
-
182
-
183
-
184
-
185
-
186
-
187
-
188
-
189
-
190
-
191
-
192
-
193
-
194
-
195
-
196
-
197
-
198
-
199
-
200
-
201
-
202
-
203
-
204
-
205
-
206
-
207
-
208
-
209
-
210
-
211
-
212
-
213
-
214
-
215
-
216
-
217
-
218
-
219
-
220
-
221
-
222
-
223
-
224
-
225
-
226
-
227
-
228
-
229
-
230
-
231
-
232
-
233
-
234
-
235
-
236
-
237
-
238
-
239
-
240
-
241
-
242
-
243
-
244
-
245
-
246
-
247
-
248
-
249
-
250
-
251
-
252
-
253
-
254
-
255
-
256
-
257
-
258
-
259
-
260
-
261
-
262
-
263
-
264
-
265
-
266
-
267
-
268
-
269
-
270
-
271
-
272
 |
 |

144 www.allstate.com
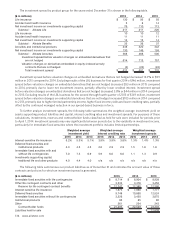
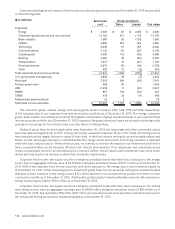
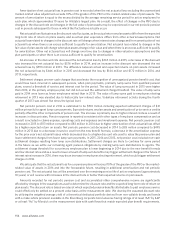
Gross unrealized gains and losses on fixed income securities by type and sector as of December 31, 2015 are provided
in the following table.
($ in millions) Amortized
cost
Gross unrealized
Fair valueGains Losses
Corporate:
Energy $ 4,549 $ 52 $ (345) $ 4,256
Consumer goods (cyclical and non‑cyclical) 12,103 210 (119) 12,194
Basic industry 1,880 28 (103) 1,805
Utilities 4,605 323 (64) 4,864
Technology 3,040 37 (57) 3,020
Communications 3,132 64 (57) 3,139
Capital goods 4,023 112 (46) 4,089
Banking 3,462 39 (42) 3,459
Transportation 1,677 73 (27) 1,723
Financial services 2,673 63 (16) 2,720
Other 530 31 (3) 558
Total corporate fixed income portfolio 41,674 1,032 (879) 41,827
U.S. government and agencies 3,836 90 (4) 3,922
Municipal 7,032 389 (20) 7,401
Foreign government 983 50 — 1,033
ABS 2,359 11 (43) 2,327
RMBS 857 100 (10) 947
CMBS 438 32 (4) 466
Redeemable preferred stock 22 3 — 25
Total fixed income securities $ 57,201 $ 1,707 $ (960) $ 57,948
The consumer goods, utilities, energy and capital goods sectors comprise 29%, 12%, 10% and 10%, respectively,
of the carrying value of our corporate fixed income securities portfolio as of December 31, 2015. The energy, consumer
goods, basic industry and utilities sectors had the highest concentration of gross unrealized losses in our corporate fixed
income securities portfolio as of December 31, 2015. In general, the gross unrealized losses are related to widening credit
spreads or increasing risk-free interest rates since the time of initial purchase.
Global oil prices have declined significantly since September 30, 2014 and natural gas and other commodity values
have also declined significantly in 2015. Among commodity exposed companies, those in the metal and mining sectors
have experienced the largest decline in values of their debt. In the fixed income and equity securities tables above and
below, oil and natural gas exposure is reflected within the energy sector and metals and mining exposure is reflected
within the basic industry sector. Within these sectors, we continue to monitor the impact to our investment portfolio for
those companies that may be adversely affected, both directly and indirectly. If oil, natural gas and commodity prices
remain at depressed levels for an extended period or decline further, certain issuers and investments may come under
duress and may result in an increase in other-than-temporary impairments.
Corporate fixed income and equity securities with gross unrealized losses that have direct exposure to the energy
sector, have an aggregate carrying value of $3.15 billion and gross unrealized losses of $377 million as of December 31,
2015. 83% of the corporate fixed income securities with direct exposure to the energy sector were investment grade as
of December 31, 2015. Of the remaining below investment grade fixed income securities with gross unrealized losses
that have a direct exposure to the energy sector, $35 million had been in an unrealized loss position for twelve or more
consecutive months as of December 31, 2015. Additionally, private equity limited partnership interests with exposure to
energy totaled approximately $350 million as of December 31, 2015.
Corporate fixed income and equity securities with gross unrealized losses that have direct exposure to the metals
and mining sectors, have an aggregate carrying value of $468 million and gross unrealized losses of $81 million as of
December 31, 2015. Approximately 55% of the $437 million of corporate fixed income securities with direct exposure to
the metals and mining sectors were investment grade as of December 31, 2015.