Allstate 2015 Annual Report Download - page 159
Download and view the complete annual report
Please find page 159 of the 2015 Allstate annual report below. You can navigate through the pages in the report by either clicking on the pages listed below, or by using the keyword search tool below to find specific information within the annual report.-
 1
1 -
2
-
3
-
4
-
5
-
6
-
7
-
8
-
9
-
10
-
11
-
12
-
13
-
14
-
15
-
16
-
17
-
18
-
19
-
20
-
21
-
22
-
23
-
24
-
25
-
26
-
27
-
28
-
29
-
30
-
31
-
32
-
33
-
34
-
35
-
36
-
37
-
38
-
39
-
40
-
41
-
42
-
43
-
44
-
45
-
46
-
47
-
48
-
49
-
50
-
51
-
52
-
53
-
54
-
55
-
56
-
57
-
58
-
59
-
60
-
61
-
62
-
63
-
64
-
65
-
66
-
67
-
68
-
69
-
70
-
71
-
72
-
73
-
74
-
75
-
76
-
77
-
78
-
79
-
80
-
81
-
82
-
83
-
84
-
85
-
86
-
87
-
88
-
89
-
90
-
91
-
92
-
93
-
94
-
95
-
96
-
97
-
98
-
99
-
100
-
101
-
102
-
103
-
104
-
105
-
106
-
107
-
108
-
109
-
110
-
111
-
112
-
113
-
114
-
115
-
116
-
117
-
118
-
119
-
120
-
121
-
122
-
123
-
124
-
125
-
126
-
127
-
128
-
129
-
130
-
131
-
132
-
133
-
134
-
135
-
136
-
137
-
138
-
139
-
140
-
141
-
142
-
143
-
144
-
145
-
146
-
147
-
148
-
 149
149 -
 150
150 -
 151
151 -
 152
152 -
 153
153 -
 154
154 -
 155
155 -
 156
156 -
 157
157 -
 158
158 -
 159
159 -
 160
160 -
 161
161 -
 162
162 -
 163
163 -
 164
164 -
 165
165 -
 166
166 -
 167
167 -
 168
168 -
 169
169 -
170
-
171
-
172
-
173
-
174
-
175
-
176
-
177
-
178
-
179
-
180
-
181
-
182
-
183
-
184
-
185
-
186
-
187
-
188
-
189
-
190
-
191
-
192
-
193
-
194
-
195
-
196
-
197
-
198
-
199
-
200
-
201
-
202
-
203
-
204
-
205
-
206
-
207
-
208
-
209
-
210
-
211
-
212
-
213
-
214
-
215
-
216
-
217
-
218
-
219
-
220
-
221
-
222
-
223
-
224
-
225
-
226
-
227
-
228
-
229
-
230
-
231
-
232
-
233
-
234
-
235
-
236
-
237
-
238
-
239
-
240
-
241
-
242
-
243
-
244
-
245
-
246
-
247
-
248
-
249
-
250
-
251
-
252
-
253
-
254
-
255
-
256
-
257
-
258
-
259
-
260
-
261
-
262
-
263
-
264
-
265
-
266
-
267
-
268
-
269
-
270
-
271
-
272
 |
 |

The Allstate Corporation 2015 Annual Report 153
PENSION AND OTHER POSTRETIREMENT PLANS
We have defined benefit pension plans, which cover most full-time, certain part-time employees and employee-
agents. Benefits are based primarily on a cash balance formula, however certain participants have a significant portion
of their benefits attributable to a former final average pay formula. 92% of the projected benefit obligation of our
primary qualified employee plan is related to the former final average pay formula. See Note 17 of the consolidated
financial statements for a complete discussion of these plans and their effect on the consolidated financial statements.
The pension and other postretirement plans may be amended or terminated at any time. Any revisions could result in
significant changes to our obligations and our obligation to fund the plans.
We report unrecognized pension and other postretirement benefit cost in the Consolidated Statements of Financial
Position as a component of accumulated other comprehensive income in shareholders’ equity. It represents the after-tax
differences between the fair value of plan assets and the projected benefit obligation (“PBO”) for pension plans and the
accumulated postretirement benefit obligation for other postretirement plans that have not yet been recognized as a
component of net periodic cost. As of December 31, 2015, unrecognized pension and other postretirement benefit cost
totaled $1.32 billion comprising $1.52 billion of unrecognized costs related to pension benefits and a $209 million gain
related to other postretirement benefits. The unrecognized pension and other postretirement benefit cost decreased by
$48 million as of December 31, 2015 from $1.36 billion as of December 31, 2014. The measurement of the unrecognized
pension and other postretirement benefit cost can vary based upon the fluctuations in the fair value of plan assets and
the actuarial assumptions used for the plans as discussed below. The reduction in the unrecognized pension and other
postretirement benefit cost is primarily related to actuarial assumptions and census data updates, including increases in
the discount rate assumptions, partially offset by lump sum payments at discount rates lower than actuarial assumptions
and asset returns that were less than expected.
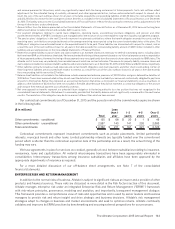
The components of net periodic pension cost for all pension plans for the years ended December 31 are as follows:
($ in millions) 2015 2014 2013
Service cost $ 114 $ 96 $ 140
Interest cost 258 262 265
Expected return on plan assets (424) (398) (394)
Amortization of:
Prior service credit (56) (58) (28)
Net actuarial loss 190 127 235
Settlement loss 31 54 277
Net periodic cost $ 113 $ 83 $ 495
The service cost component is the actuarial present value of the benefits attributed by the plans benefit formula to
services rendered by the employees during the period. Interest cost is the increase in the PBO in the period due to the
passage of time at the discount rate. Interest cost fluctuates as the discount rate changes and is also impacted by the
related change in the size of the PBO. The decrease or increase in the PBO due to an increase or decrease in the discount
rate is deferred and decreases or increases the net actuarial loss. It is recorded in accumulated other comprehensive
income as unrecognized pension benefit cost and may be amortized.
The expected return on plan assets is determined as the product of the expected long-term rate of return on plan
assets and the adjusted fair value of plan assets, referred to as the market-related value of plan assets. To determine
the market-related value, the fair value of plan assets is adjusted annually so that differences between changes in the
fair value of equity securities and hedge fund limited partnerships and the expected long-term rate of return on these
securities are recognized into the market-related value of plan assets over a five year period. We believe this is consistent
with the long-term nature of pension obligations.
When the actual return on plan assets exceeds the expected return on plan assets it reduces the net actuarial loss;
when the expected return exceeds the actual return it increases the net actuarial loss. It is recorded in accumulated
other comprehensive income as unrecognized pension benefit cost and may be amortized. The market-related value
adjustment represents the current difference between actual returns and expected returns on equity securities and
hedge fund limited partnerships recognized over a five year period. The market-related value adjustment is a deferred
net loss of $139 million as of December 31, 2015. The expected return on plan assets fluctuates when the market-related
value of plan assets changes and when the expected long-term rate of return on plan assets assumption changes.