Allstate 2015 Annual Report Download - page 225
Download and view the complete annual report
Please find page 225 of the 2015 Allstate annual report below. You can navigate through the pages in the report by either clicking on the pages listed below, or by using the keyword search tool below to find specific information within the annual report.-
 1
1 -
2
-
3
-
4
-
5
-
6
-
7
-
8
-
9
-
10
-
11
-
12
-
13
-
14
-
15
-
16
-
17
-
18
-
19
-
20
-
21
-
22
-
23
-
24
-
25
-
26
-
27
-
28
-
29
-
30
-
31
-
32
-
33
-
34
-
35
-
36
-
37
-
38
-
39
-
40
-
41
-
42
-
43
-
44
-
45
-
46
-
47
-
48
-
49
-
50
-
51
-
52
-
53
-
54
-
55
-
56
-
57
-
58
-
59
-
60
-
61
-
62
-
63
-
64
-
65
-
66
-
67
-
68
-
69
-
70
-
71
-
72
-
73
-
74
-
75
-
76
-
77
-
78
-
79
-
80
-
81
-
82
-
83
-
84
-
85
-
86
-
87
-
88
-
89
-
90
-
91
-
92
-
93
-
94
-
95
-
96
-
97
-
98
-
99
-
100
-
101
-
102
-
103
-
104
-
105
-
106
-
107
-
108
-
109
-
110
-
111
-
112
-
113
-
114
-
115
-
116
-
117
-
118
-
119
-
120
-
121
-
122
-
123
-
124
-
125
-
126
-
127
-
128
-
129
-
130
-
131
-
132
-
133
-
134
-
135
-
136
-
137
-
138
-
139
-
140
-
141
-
142
-
143
-
144
-
145
-
146
-
147
-
148
-
149
-
150
-
151
-
152
-
153
-
154
-
155
-
156
-
157
-
158
-
159
-
160
-
161
-
162
-
163
-
164
-
165
-
166
-
167
-
168
-
169
-
170
-
171
-
172
-
173
-
174
-
175
-
176
-
177
-
178
-
179
-
180
-
181
-
182
-
183
-
184
-
185
-
186
-
187
-
188
-
189
-
190
-
191
-
192
-
193
-
194
-
195
-
196
-
197
-
198
-
199
-
200
-
201
-
202
-
203
-
204
-
205
-
206
-
207
-
208
-
209
-
210
-
211
-
212
-
213
-
214
-
 215
215 -
 216
216 -
 217
217 -
 218
218 -
 219
219 -
 220
220 -
 221
221 -
 222
222 -
 223
223 -
 224
224 -
 225
225 -
 226
226 -
 227
227 -
 228
228 -
 229
229 -
 230
230 -
 231
231 -
 232
232 -
 233
233 -
 234
234 -
 235
235 -
236
-
237
-
238
-
239
-
240
-
241
-
242
-
243
-
244
-
245
-
246
-
247
-
248
-
249
-
250
-
251
-
252
-
253
-
254
-
255
-
256
-
257
-
258
-
259
-
260
-
261
-
262
-
263
-
264
-
265
-
266
-
267
-
268
-
269
-
270
-
271
-
272
 |
 |

The Allstate Corporation 2015 Annual Report 219
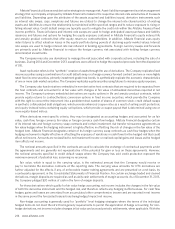
level. Credit-risk-contingent cross-default provisions allow the counterparties to terminate the derivative agreement if
the Company defaults by pre-determined threshold amounts on certain debt instruments. Credit-risk-contingent credit
support annex agreements specify the amount of collateral the Company must post to counterparties based on AIC’s,
ALIC’s or ALNY’s financial strength credit ratings by Moody’s or S&P, or in the event AIC, ALIC or ALNY are no longer
rated by either Moody’s or S&P.
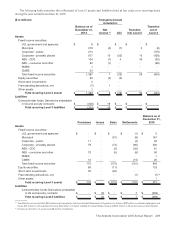
The following summarizes the fair value of derivative instruments with termination, cross-default or collateral credit-
risk-contingent features that are in a liability position as of December31, as well as the fair value of assets and collateral
that are netted against the liability in accordance with provisions within legally enforceable MNAs.
($ in millions) 2015 2014
Gross liability fair value of contracts containing credit‑risk‑contingent features $ 21 $ 16
Gross asset fair value of contracts containing credit‑risk‑contingent features
and subject to MNAs (3) (4)
Collateral posted under MNAs for contracts containing credit‑risk‑contingent features (13) (7)
Maximum amount of additional exposure for contracts with credit‑risk‑contingent features if all
features were triggered concurrently $ 5 $ 5
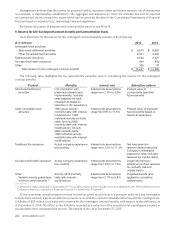
Credit derivatives– selling protection
Free-standing credit default swaps (“CDS”) are utilized for selling credit protection against a specified credit event.
A credit default swap is a derivative instrument, representing an agreement between two parties to exchange the credit
risk of a specified entity (or a group of entities), or an index based on the credit risk of a group of entities (all commonly
referred to as the “reference entity” or a portfolio of “reference entities”), in return for a periodic premium. In selling
protection, CDS are used to replicate fixed income securities and to complement the cash market when credit exposure
to certain issuers is not available or when the derivative alternative is less expensive than the cash market alternative.
CDS typically have a five-year term.
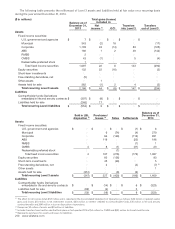
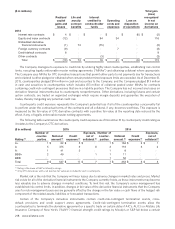
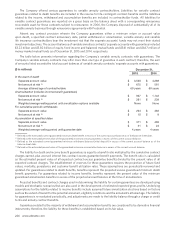
The following table shows the CDS notional amounts by credit rating and fair value of protection sold.
($ in millions) Notional amount
AA A BBB
BB and
lower Total
Fair
value
December 31, 2015
Single name
Corporate debt $ 20 $ 10 $ 45 $ — $ 75 $ 1
First-to-default Basket
Municipal — — 100 — 100 (8)
Index
Corporate debt 1 20 52 7 80 1
Total $21 $ 30 $ 197 $ 7 $ 255 $ (6)
December 31, 2014
Single name
Corporate debt $ 20 $ 15 $ 90 $ — $ 125 $ 1
First-to-default Basket
Municipal — 100 — — 100 (9)
Index
Corporate debt — 22 52 6 80 2
Total $20 $ 137 $ 142 $ 6 $ 305 $ (6)
In selling protection with CDS, the Company sells credit protection on an identified single name, a basket of names
in a first-to-default (“FTD”) structure or credit derivative index (“CDX”) that is generally investment grade, and in return
receives periodic premiums through expiration or termination of the agreement. With single name CDS, this premium
or credit spread generally corresponds to the difference between the yield on the reference entity’s public fixed maturity
cash instruments and swap rates at the time the agreement is executed. With a FTD basket, because of the additional
credit risk inherent in a basket of named reference entities, the premium generally corresponds to a high proportion of
the sum of the credit spreads of the names in the basket and the correlation between the names. CDX is utilized to take
a position on multiple (generally 125) reference entities. Credit events are typically defined as bankruptcy, failure to pay,