Allstate 2015 Annual Report Download - page 259
Download and view the complete annual report
Please find page 259 of the 2015 Allstate annual report below. You can navigate through the pages in the report by either clicking on the pages listed below, or by using the keyword search tool below to find specific information within the annual report.-
 1
1 -
2
-
3
-
4
-
5
-
6
-
7
-
8
-
9
-
10
-
11
-
12
-
13
-
14
-
15
-
16
-
17
-
18
-
19
-
20
-
21
-
22
-
23
-
24
-
25
-
26
-
27
-
28
-
29
-
30
-
31
-
32
-
33
-
34
-
35
-
36
-
37
-
38
-
39
-
40
-
41
-
42
-
43
-
44
-
45
-
46
-
47
-
48
-
49
-
50
-
51
-
52
-
53
-
54
-
55
-
56
-
57
-
58
-
59
-
60
-
61
-
62
-
63
-
64
-
65
-
66
-
67
-
68
-
69
-
70
-
71
-
72
-
73
-
74
-
75
-
76
-
77
-
78
-
79
-
80
-
81
-
82
-
83
-
84
-
85
-
86
-
87
-
88
-
89
-
90
-
91
-
92
-
93
-
94
-
95
-
96
-
97
-
98
-
99
-
100
-
101
-
102
-
103
-
104
-
105
-
106
-
107
-
108
-
109
-
110
-
111
-
112
-
113
-
114
-
115
-
116
-
117
-
118
-
119
-
120
-
121
-
122
-
123
-
124
-
125
-
126
-
127
-
128
-
129
-
130
-
131
-
132
-
133
-
134
-
135
-
136
-
137
-
138
-
139
-
140
-
141
-
142
-
143
-
144
-
145
-
146
-
147
-
148
-
149
-
150
-
151
-
152
-
153
-
154
-
155
-
156
-
157
-
158
-
159
-
160
-
161
-
162
-
163
-
164
-
165
-
166
-
167
-
168
-
169
-
170
-
171
-
172
-
173
-
174
-
175
-
176
-
177
-
178
-
179
-
180
-
181
-
182
-
183
-
184
-
185
-
186
-
187
-
188
-
189
-
190
-
191
-
192
-
193
-
194
-
195
-
196
-
197
-
198
-
199
-
200
-
201
-
202
-
203
-
204
-
205
-
206
-
207
-
208
-
209
-
210
-
211
-
212
-
213
-
214
-
215
-
216
-
217
-
218
-
219
-
220
-
221
-
222
-
223
-
224
-
225
-
226
-
227
-
228
-
229
-
230
-
231
-
232
-
233
-
234
-
235
-
236
-
237
-
238
-
239
-
240
-
241
-
242
-
243
-
244
-
245
-
246
-
247
-
248
-
 249
249 -
 250
250 -
 251
251 -
 252
252 -
 253
253 -
 254
254 -
 255
255 -
 256
256 -
 257
257 -
 258
258 -
 259
259 -
 260
260 -
 261
261 -
 262
262 -
 263
263 -
 264
264 -
 265
265 -
 266
266 -
 267
267 -
 268
268 -
 269
269 -
270
-
271
-
272
 |
 |

The Allstate Corporation 2015 Annual Report 253
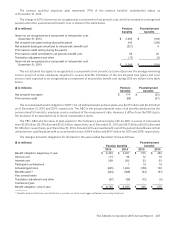
The Company made $2 million, $3 million and $2 million in contributions to the ESOP in 2015, 2014 and 2013,
respectively. As of December31, 2015, total committed to be released, allocated and unallocated ESOP shares were 1
million, 36 million and 2 million, respectively.
Allstate’s Canadian, Esurance and Answer Financial subsidiaries sponsor defined contribution plans for their eligible
employees. Expense for these plans was $10 million, $11 million and $11 million in 2015, 2014 and 2013, respectively.
18. Equity Incentive Plans
The Company currently has equity incentive plans under which the Company grants nonqualified stock options, restricted
stock units and performance stock awards to certain employees and directors of the Company. The total compensation
expense related to equity awards was $81 million, $88 million and $93 million and the total income tax benefits were $28
million, $30 million and $32 million for 2015, 2014 and 2013, respectively. Total cash received from the exercise of options
was $187 million, $314 million and $212 million for 2015, 2014 and 2013, respectively. Total tax benefit realized on options
exercised and stock unrestricted was $82 million, $73 million and $65 million for 2015, 2014 and 2013, respectively.
The Company records compensation expense related to awards under these plans over the shorter of the period
in which the requisite service is rendered or retirement eligibility is attained. Compensation expense for performance
share awards is based on the probable number of awards expected to vest using the performance level most likely to be
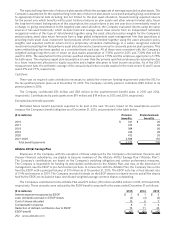
achieved at the end of the performance period. As of December31, 2015, total unrecognized compensation cost related
to all nonvested awards was $71 million, of which $28 million related to nonqualified stock options which are expected
to be recognized over the weighted average vesting period of 1.60years, $35 million related to restricted stock units
which are expected to be recognized over the weighted average vesting period of 1.84years and $8 million related to
performance stock awards which are expected to be recognized over the weighted average vesting period of 1.49years.
Options are granted to employees with exercise prices equal to the closing share price of the Company’s common
stock on the applicable grant date. Options granted to employees on or after February 18, 2014 vest ratably over a
three-year period. Options granted prior to February18, 2014 vest 50% on the second anniversary of the grant date and
25% on each of the third and fourth anniversaries of the grant date. Vesting is subject to continued service, except for
employees who are retirement eligible and in certain other limited circumstances. Options may be exercised once vested
and will expire no later than ten years after the date of grant.
Restricted stock units granted on or after February18, 2014 vest and convert in full on the third anniversary of the
grant date, except for directors whose awards vest immediately and convert after leaving the board. Restricted stock
units granted to employees prior to February18, 2014 convert 50% on the second anniversary of the grant date and
25% on each of the third and fourth anniversaries of the grant date. Vesting is subject to continued service, except for
employees who are retirement eligible and in certain other limited circumstances.
Performance stock awards vest and convert into shares of stock on the third anniversary of the grant date. Vesting
of the number of performance stock awards earned based on the attainment of performance goals for each of the
performance periods is subject to continued service, except for employees who are retirement eligible and in certain
other limited circumstances, and achievement of performance goals.
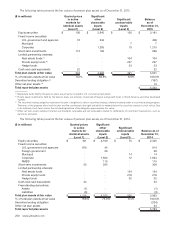
A total of 97.6 million shares of common stock were authorized to be used for awards under the plans, subject
to adjustment in accordance with the plans’ terms. As of December31, 2015, 25.8 million shares were reserved and
remained available for future issuance under these plans. The Company uses its treasury shares for these issuances.
The fair value of each option grant is estimated on the date of grant using a binomial lattice model. The Company uses
historical data to estimate option exercise and employee termination within the valuation model. In addition, separate
groups of employees that have similar historical exercise behavior are considered separately for valuation purposes. The
expected term of options granted is derived from the output of the binominal lattice model and represents the period of
time that options granted are expected to be outstanding. The expected volatility of the price of the underlying shares is
implied based on traded options and historical volatility of the Company’s common stock. The expected dividends were
based on the current dividend yield of the Company’s stock as of the date of the grant. The risk-free rate for periods
within the contractual life of the option is based on the U.S. Treasury yield curve in effect at the time of grant. The
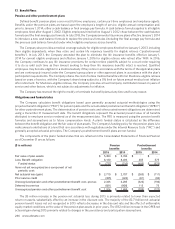
assumptions used are shown in the following table.
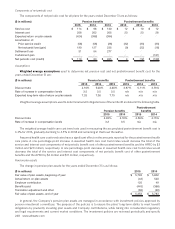
2015 2014 2013
Weighted average expected term 6.5 years 6.5 years 8.2 years
Expected volatility 16.0 ‑ 37.8% 16.8 ‑ 42.2% 19.1 ‑ 48.1%
Weighted average volatility 24.7% 28.3% 31.0%
Expected dividends 1.6 ‑ 2.1% 1.7 ‑ 2.2% 1.9 ‑ 2.2%
Weighted average expected dividends 1.7% 2.1% 2.2%
Risk‑free rate 0.0 ‑ 2.4% 0.0 ‑ 3.0% 0.0 ‑ 2.9%