Allstate 2015 Annual Report Download - page 121
Download and view the complete annual report
Please find page 121 of the 2015 Allstate annual report below. You can navigate through the pages in the report by either clicking on the pages listed below, or by using the keyword search tool below to find specific information within the annual report.-
 1
1 -
2
-
3
-
4
-
5
-
6
-
7
-
8
-
9
-
10
-
11
-
12
-
13
-
14
-
15
-
16
-
17
-
18
-
19
-
20
-
21
-
22
-
23
-
24
-
25
-
26
-
27
-
28
-
29
-
30
-
31
-
32
-
33
-
34
-
35
-
36
-
37
-
38
-
39
-
40
-
41
-
42
-
43
-
44
-
45
-
46
-
47
-
48
-
49
-
50
-
51
-
52
-
53
-
54
-
55
-
56
-
57
-
58
-
59
-
60
-
61
-
62
-
63
-
64
-
65
-
66
-
67
-
68
-
69
-
70
-
71
-
72
-
73
-
74
-
75
-
76
-
77
-
78
-
79
-
80
-
81
-
82
-
83
-
84
-
85
-
86
-
87
-
88
-
89
-
90
-
91
-
92
-
93
-
94
-
95
-
96
-
97
-
98
-
99
-
100
-
101
-
102
-
103
-
104
-
105
-
106
-
107
-
108
-
109
-
110
-
 111
111 -
 112
112 -
 113
113 -
 114
114 -
 115
115 -
 116
116 -
 117
117 -
 118
118 -
 119
119 -
 120
120 -
 121
121 -
 122
122 -
 123
123 -
 124
124 -
 125
125 -
 126
126 -
 127
127 -
 128
128 -
 129
129 -
 130
130 -
 131
131 -
132
-
133
-
134
-
135
-
136
-
137
-
138
-
139
-
140
-
141
-
142
-
143
-
144
-
145
-
146
-
147
-
148
-
149
-
150
-
151
-
152
-
153
-
154
-
155
-
156
-
157
-
158
-
159
-
160
-
161
-
162
-
163
-
164
-
165
-
166
-
167
-
168
-
169
-
170
-
171
-
172
-
173
-
174
-
175
-
176
-
177
-
178
-
179
-
180
-
181
-
182
-
183
-
184
-
185
-
186
-
187
-
188
-
189
-
190
-
191
-
192
-
193
-
194
-
195
-
196
-
197
-
198
-
199
-
200
-
201
-
202
-
203
-
204
-
205
-
206
-
207
-
208
-
209
-
210
-
211
-
212
-
213
-
214
-
215
-
216
-
217
-
218
-
219
-
220
-
221
-
222
-
223
-
224
-
225
-
226
-
227
-
228
-
229
-
230
-
231
-
232
-
233
-
234
-
235
-
236
-
237
-
238
-
239
-
240
-
241
-
242
-
243
-
244
-
245
-
246
-
247
-
248
-
249
-
250
-
251
-
252
-
253
-
254
-
255
-
256
-
257
-
258
-
259
-
260
-
261
-
262
-
263
-
264
-
265
-
266
-
267
-
268
-
269
-
270
-
271
-
272
 |
 |

The Allstate Corporation 2015 Annual Report 115
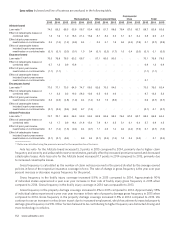
expanding into the Canadian market. Esurance’s annual combined ratio is below 100, excluding amortization of purchased
intangible assets, after the year of policy inception (in which substantially all acquisition costs are incurred), driven by pricing
changes and customer mix. We manage the direct to consumer business based on its profitability over the life-time of the policy.
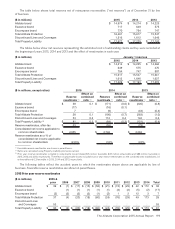
Encompass brand expense ratio decreased 1.6 points in 2015 compared to 2014 primarily due to agency compensation,
employee compensation and technology costs. Expense improvement actions include reductions in technology and other
costs, as well as improving operating efficiency. The Encompass brand DAC amortization rate is higher on average than
Allstate brand DAC amortization due to higher commission rates paid to independent agencies.
Encompass brand expense ratio decreased 0.4 points in 2014 compared to 2013 primarily due to lower employee
related costs, including pension expense, partially offset by higher amortization of DAC.
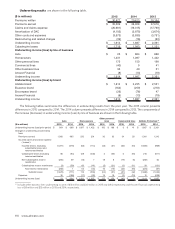
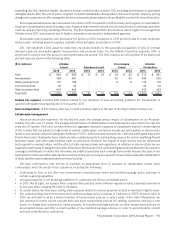
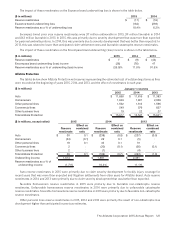
DAC We establish a DAC asset for costs that are related directly to the successful acquisition of new or renewal
insurance policies, principally agents’ remuneration and premium taxes. For the Allstate Protection business, DAC is
amortized to income over the period in which premiums are earned. The DAC balance as of December31 by brand and
product type are shown in the following table.
($ in millions) Allstate
brand Esurance brand
Encompass
brand
Allstate
Protection
2015 2014 2015 2014 2015 2014 2015 2014
Auto $ 644 $ 609 $ 10 $ 10 $ 59 $ 62 $ 713 $ 681
Homeowners 504 491 — — 42 43 546 534
Other personal lines 110 109 — — 8 9 118 118
Commercial lines 33 34 — — — — 33 34
Other business lines 619 453 — — — — 619 453
Total DAC $ 1,910 $ 1,696 $ 10 $ 10 $ 109 $ 114 $ 2,029 $ 1,820
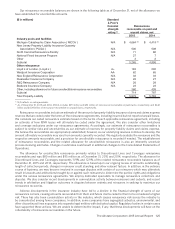
Income tax expense included $28 million related to our adoption of new accounting guidance for investments in
qualified affordable housing projects in first quarter 2015.
Gain on disposition of $37million, after-tax, in 2014 primarily relates to the sale of Sterling Collision Centers,Inc.
Catastrophe management
Historical catastrophe experience For the last ten years, the average annual impact of catastrophes on our Property-
Liability loss ratio was 7.7 points. The average annual impact of catastrophes on the homeowners loss ratio for the last ten
years was 31.1 points. Over time, we have limited our aggregate insurance exposure to catastrophe losses in certain regions
of the country that are subject to high levels of natural catastrophes. Limitations include our participation in various state
facilities, such as the California Earthquake Authority (“CEA”), which provides insurance for California earthquake losses; the
Florida Hurricane Catastrophe Fund, which provides reimbursements to participating insurers for certain qualifying Florida
hurricane losses; and other state facilities, such as wind pools. However, the impact of these actions may be diminished
by the growth in insured values, and the effect of state insurance laws and regulations. In addition, in various states we are
required to participate in assigned risk plans, reinsurance facilities and joint underwriting associations that provide insurance
coverage to individuals or entities that otherwise are unable to purchase such coverage from private insurers. Because of our
participation in these and other state facilities such as wind pools, we may be exposed to losses that surpass the capitalization
of these facilities and to assessments from these facilities.
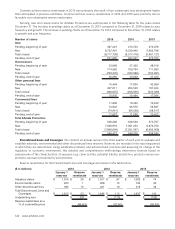
We have continued to take actions to maintain an appropriate level of exposure to catastrophic events while
continuing to meet the needs of our customers, including the following:
• Continuing to limit or not offer new homeowners, manufactured home and landlord package policy business in
certain coastal geographies.
• Increased capacity in our brokerage platform for customers not offered an Allstate policy.
• In 2015, North Light, our surplus lines company that operates under different regulatory rules, expanded operations
to one new state, bringing the total to 43 states.
• In certain states, we have been ceding wind exposure related to insured property located in wind pool eligible areas.
• We ceased writing new homeowners and landlord package policy business in California in 2007; however, later in
2016 we will start to write a limited number of homeowners policies in select areas of the state. Meanwhile, we
will continue to renew current policyholders and allow replacement policies for existing customers who buy a new
home, or change their residence to rental property. For landlord package policies we allow replacement policies on
an exception basis, and offer a small number of new landlord package policies in order to accommodate current
personal umbrella policy customers.