Allstate 2015 Annual Report Download - page 218
Download and view the complete annual report
Please find page 218 of the 2015 Allstate annual report below. You can navigate through the pages in the report by either clicking on the pages listed below, or by using the keyword search tool below to find specific information within the annual report.-
 1
1 -
2
-
3
-
4
-
5
-
6
-
7
-
8
-
9
-
10
-
11
-
12
-
13
-
14
-
15
-
16
-
17
-
18
-
19
-
20
-
21
-
22
-
23
-
24
-
25
-
26
-
27
-
28
-
29
-
30
-
31
-
32
-
33
-
34
-
35
-
36
-
37
-
38
-
39
-
40
-
41
-
42
-
43
-
44
-
45
-
46
-
47
-
48
-
49
-
50
-
51
-
52
-
53
-
54
-
55
-
56
-
57
-
58
-
59
-
60
-
61
-
62
-
63
-
64
-
65
-
66
-
67
-
68
-
69
-
70
-
71
-
72
-
73
-
74
-
75
-
76
-
77
-
78
-
79
-
80
-
81
-
82
-
83
-
84
-
85
-
86
-
87
-
88
-
89
-
90
-
91
-
92
-
93
-
94
-
95
-
96
-
97
-
98
-
99
-
100
-
101
-
102
-
103
-
104
-
105
-
106
-
107
-
108
-
109
-
110
-
111
-
112
-
113
-
114
-
115
-
116
-
117
-
118
-
119
-
120
-
121
-
122
-
123
-
124
-
125
-
126
-
127
-
128
-
129
-
130
-
131
-
132
-
133
-
134
-
135
-
136
-
137
-
138
-
139
-
140
-
141
-
142
-
143
-
144
-
145
-
146
-
147
-
148
-
149
-
150
-
151
-
152
-
153
-
154
-
155
-
156
-
157
-
158
-
159
-
160
-
161
-
162
-
163
-
164
-
165
-
166
-
167
-
168
-
169
-
170
-
171
-
172
-
173
-
174
-
175
-
176
-
177
-
178
-
179
-
180
-
181
-
182
-
183
-
184
-
185
-
186
-
187
-
188
-
189
-
190
-
191
-
192
-
193
-
194
-
195
-
196
-
197
-
198
-
199
-
200
-
201
-
202
-
203
-
204
-
205
-
206
-
207
-
 208
208 -
 209
209 -
 210
210 -
 211
211 -
 212
212 -
 213
213 -
 214
214 -
 215
215 -
 216
216 -
 217
217 -
 218
218 -
 219
219 -
 220
220 -
 221
221 -
 222
222 -
 223
223 -
 224
224 -
 225
225 -
 226
226 -
 227
227 -
 228
228 -
229
-
230
-
231
-
232
-
233
-
234
-
235
-
236
-
237
-
238
-
239
-
240
-
241
-
242
-
243
-
244
-
245
-
246
-
247
-
248
-
249
-
250
-
251
-
252
-
253
-
254
-
255
-
256
-
257
-
258
-
259
-
260
-
261
-
262
-
263
-
264
-
265
-
266
-
267
-
268
-
269
-
270
-
271
-
272
 |
 |

212 www.allstate.com
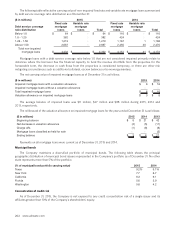
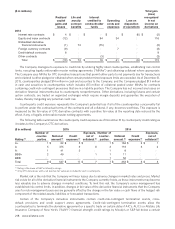
Transfers between level categorizations may occur due to changes in the availability of market observable inputs,
which generally are caused by changes in market conditions such as liquidity, trading volume or bid-ask spreads. Transfers
between level categorizations may also occur due to changes in the valuation source. For example, in situations where a
fair value quote is not provided by the Company’s independent third-party valuation service provider and as a result the
price is stale or has been replaced with a broker quote whose inputs have not been corroborated to be market observable,
the security is transferred into Level 3. Transfers in and out of level categorizations are reported as having occurred at the
beginning of the quarter in which the transfer occurred. Therefore, for all transfers into Level 3, all realized and changes
in unrealized gains and losses in the quarter of transfer are reflected in the Level 3 rollforward table.
There were no transfers between Level 1 and Level 2 during 2015, 2014 or 2013.
Transfers into Level 3 during 2015, 2014 and 2013 included situations where a fair value quote was not provided by the
Company’s independent third-party valuation service provider and as a result the price was stale or had been replaced
with a broker quote where the inputs had not been corroborated to be market observable resulting in the security being
classified as Level 3. Transfers out of Level 3 during 2015, 2014 and 2013 included situations where a broker quote was
used in the prior period and a fair value quote became available from the Company’s independent third-party valuation
service provider in the current period. A quote utilizing the new pricing source was not available as of the prior period,
and any gains or losses related to the change in valuation source for individual securities were not significant.
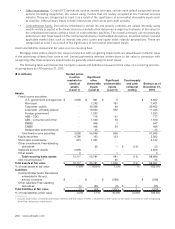
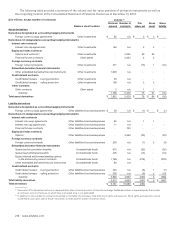
The following table provides the change in unrealized gains and losses included in net income for Level 3 assets and
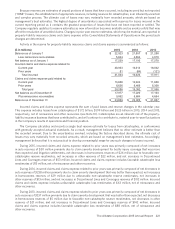
liabilities held as of December 31.
($ in millions) 2015 2014 2013
Assets
Fixed income securities:
Municipal $ (12) $ (7) $ (19)
Corporate 11 11 13
ABS 2 1 (1)
RMBS — (1) (1)
CMBS — — (2)
Total fixed income securities 1 4 (10)
Equity securities (4) — —
Free‑standing derivatives, net 1 5 10
Other assets — 1 (1)
Assets held for sale — — (2)
Total recurring Level 3 assets $ (2) $ 10 $ (3)
Liabilities
Contractholder funds: Derivatives embedded in life and
annuity contracts $ 19 $ (8) $ 89
Liabilities held for sale — 17 20
Total recurring Level 3 liabilities $ 19 $ 9 $ 109
The amounts in the table above represent the change in unrealized gains and losses included in net income for the
period of time that the asset or liability was determined to be in Level 3. These gains and losses total $17 million in 2015
and are reported as follows: $(20) million in realized capital gains and losses, $18 million in net investment income, $26
million in interest credited to contractholder funds and $(7) million in life and annuity contract benefits. These gains and
losses total $19 million in 2014 and are reported as follows: $(3) million in realized capital gains and losses, $12 million
in net investment income, $(5) million in interest credited to contractholder funds and $15 million in life and annuity
contract benefits. These gains and losses total $106 million in 2013 and are reported as follows: $(9) million in realized
capital gains and losses, $12 million in net investment income, $35 million in interest credited to contractholder funds,
$74 million in life and annuity contract benefits and $(6) million in loss on disposition of operations.