Allstate 2015 Annual Report Download - page 236
Download and view the complete annual report
Please find page 236 of the 2015 Allstate annual report below. You can navigate through the pages in the report by either clicking on the pages listed below, or by using the keyword search tool below to find specific information within the annual report.-
 1
1 -
2
-
3
-
4
-
5
-
6
-
7
-
8
-
9
-
10
-
11
-
12
-
13
-
14
-
15
-
16
-
17
-
18
-
19
-
20
-
21
-
22
-
23
-
24
-
25
-
26
-
27
-
28
-
29
-
30
-
31
-
32
-
33
-
34
-
35
-
36
-
37
-
38
-
39
-
40
-
41
-
42
-
43
-
44
-
45
-
46
-
47
-
48
-
49
-
50
-
51
-
52
-
53
-
54
-
55
-
56
-
57
-
58
-
59
-
60
-
61
-
62
-
63
-
64
-
65
-
66
-
67
-
68
-
69
-
70
-
71
-
72
-
73
-
74
-
75
-
76
-
77
-
78
-
79
-
80
-
81
-
82
-
83
-
84
-
85
-
86
-
87
-
88
-
89
-
90
-
91
-
92
-
93
-
94
-
95
-
96
-
97
-
98
-
99
-
100
-
101
-
102
-
103
-
104
-
105
-
106
-
107
-
108
-
109
-
110
-
111
-
112
-
113
-
114
-
115
-
116
-
117
-
118
-
119
-
120
-
121
-
122
-
123
-
124
-
125
-
126
-
127
-
128
-
129
-
130
-
131
-
132
-
133
-
134
-
135
-
136
-
137
-
138
-
139
-
140
-
141
-
142
-
143
-
144
-
145
-
146
-
147
-
148
-
149
-
150
-
151
-
152
-
153
-
154
-
155
-
156
-
157
-
158
-
159
-
160
-
161
-
162
-
163
-
164
-
165
-
166
-
167
-
168
-
169
-
170
-
171
-
172
-
173
-
174
-
175
-
176
-
177
-
178
-
179
-
180
-
181
-
182
-
183
-
184
-
185
-
186
-
187
-
188
-
189
-
190
-
191
-
192
-
193
-
194
-
195
-
196
-
197
-
198
-
199
-
200
-
201
-
202
-
203
-
204
-
205
-
206
-
207
-
208
-
209
-
210
-
211
-
212
-
213
-
214
-
215
-
216
-
217
-
218
-
219
-
220
-
221
-
222
-
223
-
224
-
225
-
 226
226 -
 227
227 -
 228
228 -
 229
229 -
 230
230 -
 231
231 -
 232
232 -
 233
233 -
 234
234 -
 235
235 -
 236
236 -
 237
237 -
 238
238 -
 239
239 -
 240
240 -
 241
241 -
 242
242 -
 243
243 -
 244
244 -
 245
245 -
 246
246 -
247
-
248
-
249
-
250
-
251
-
252
-
253
-
254
-
255
-
256
-
257
-
258
-
259
-
260
-
261
-
262
-
263
-
264
-
265
-
266
-
267
-
268
-
269
-
270
-
271
-
272
 |
 |

230 www.allstate.com
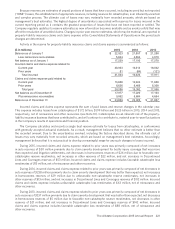
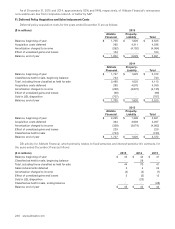
As of December31, 2015 and 2014, approximately 92% and 94%, respectively, of Allstate Financial’s reinsurance
recoverables are due from companies rated A- or better by S&P.
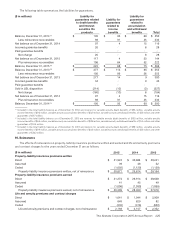
11. Deferred Policy Acquisition and Sales Inducement Costs
Deferred policy acquisition costs for the years ended December31 are as follows:
($ in millions) 2015
Allstate
Financial
Property-
Liability Total
Balance, beginning of year $ 1,705 $ 1,820 $ 3,525
Acquisition costs deferred 285 4,311 4,596
Amortization charged to income (262) (4,102) (4,364)
Effect of unrealized gains and losses 104 — 104
Balance, end of year $ 1,832 $ 2,029 $ 3,861
2014
Allstate
Financial
Property-
Liability Total
Balance, beginning of year $ 1,747 $ 1,625 $ 3,372
Classified as held for sale, beginning balance 743 — 743
Total, including those classified as held for sale 2,490 1,625 4,115
Acquisition costs deferred 280 4,070 4,350
Amortization charged to income (260) (3,875) (4,135)
Effect of unrealized gains and losses (98) — (98)
Sold in LBL disposition (707) — (707)
Balance, end of year $ 1,705 $ 1,820 $ 3,525
2013
Allstate
Financial
Property-
Liability Total
Balance, beginning of year $ 2,225 $ 1,396 $ 3,621
Acquisition costs deferred 364 3,903 4,267
Amortization charged to income (328) (3,674) (4,002)
Effect of unrealized gains and losses 229 — 229
Classified as held for sale (743) — (743)
Balance, end of year $ 1,747 $ 1,625 $ 3,372
DSI activity for Allstate Financial, which primarily relates to fixed annuities and interest-sensitive life contracts, for
the years ended December31 was as follows:
($ in millions) 2015 2014 2013
Balance, beginning of year $ 44 $ 42 $ 41
Classified as held for sale, beginning balance — 28 —
Total, including those classified as held for sale 44 70 41
Sales inducements deferred 3 4 24
Amortization charged to income (4) (4) (7)
Effect of unrealized gains and losses 2 (3) 12
Sold in LBL disposition — (23) —
Classified as held for sale, ending balance — — (28)
Balance, end of year $ 45 $ 44 $ 42