Allstate 2015 Annual Report Download - page 258
Download and view the complete annual report
Please find page 258 of the 2015 Allstate annual report below. You can navigate through the pages in the report by either clicking on the pages listed below, or by using the keyword search tool below to find specific information within the annual report.-
 1
1 -
2
-
3
-
4
-
5
-
6
-
7
-
8
-
9
-
10
-
11
-
12
-
13
-
14
-
15
-
16
-
17
-
18
-
19
-
20
-
21
-
22
-
23
-
24
-
25
-
26
-
27
-
28
-
29
-
30
-
31
-
32
-
33
-
34
-
35
-
36
-
37
-
38
-
39
-
40
-
41
-
42
-
43
-
44
-
45
-
46
-
47
-
48
-
49
-
50
-
51
-
52
-
53
-
54
-
55
-
56
-
57
-
58
-
59
-
60
-
61
-
62
-
63
-
64
-
65
-
66
-
67
-
68
-
69
-
70
-
71
-
72
-
73
-
74
-
75
-
76
-
77
-
78
-
79
-
80
-
81
-
82
-
83
-
84
-
85
-
86
-
87
-
88
-
89
-
90
-
91
-
92
-
93
-
94
-
95
-
96
-
97
-
98
-
99
-
100
-
101
-
102
-
103
-
104
-
105
-
106
-
107
-
108
-
109
-
110
-
111
-
112
-
113
-
114
-
115
-
116
-
117
-
118
-
119
-
120
-
121
-
122
-
123
-
124
-
125
-
126
-
127
-
128
-
129
-
130
-
131
-
132
-
133
-
134
-
135
-
136
-
137
-
138
-
139
-
140
-
141
-
142
-
143
-
144
-
145
-
146
-
147
-
148
-
149
-
150
-
151
-
152
-
153
-
154
-
155
-
156
-
157
-
158
-
159
-
160
-
161
-
162
-
163
-
164
-
165
-
166
-
167
-
168
-
169
-
170
-
171
-
172
-
173
-
174
-
175
-
176
-
177
-
178
-
179
-
180
-
181
-
182
-
183
-
184
-
185
-
186
-
187
-
188
-
189
-
190
-
191
-
192
-
193
-
194
-
195
-
196
-
197
-
198
-
199
-
200
-
201
-
202
-
203
-
204
-
205
-
206
-
207
-
208
-
209
-
210
-
211
-
212
-
213
-
214
-
215
-
216
-
217
-
218
-
219
-
220
-
221
-
222
-
223
-
224
-
225
-
226
-
227
-
228
-
229
-
230
-
231
-
232
-
233
-
234
-
235
-
236
-
237
-
238
-
239
-
240
-
241
-
242
-
243
-
244
-
245
-
246
-
247
-
 248
248 -
 249
249 -
 250
250 -
 251
251 -
 252
252 -
 253
253 -
 254
254 -
 255
255 -
 256
256 -
 257
257 -
 258
258 -
 259
259 -
 260
260 -
 261
261 -
 262
262 -
 263
263 -
 264
264 -
 265
265 -
 266
266 -
 267
267 -
 268
268 -
269
-
270
-
271
-
272
 |
 |

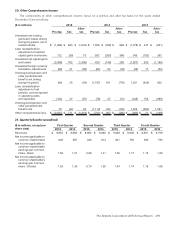
252 www.allstate.com
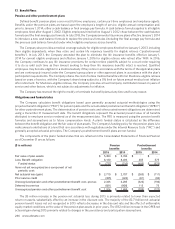
The expected long-term rate of return on plan assets reflects the average rate of earnings expected on plan assets. The
Company’s assumption for the expected long-term rate of return on plan assets is reviewed annually giving consideration
to appropriate financial data including, but not limited to, the plan asset allocation, forward-looking expected returns
for the period over which benefits will be paid, historical returns on plan assets and other relevant market data. Given
the long-term forward looking nature of this assumption, the actual returns in any one year do not immediately result in
a change. In giving consideration to the targeted plan asset allocation, the Company evaluated returns using the same
sources it has used historically which include: historical average asset class returns from an independent nationally
recognized vendor of this type of data blended together using the asset allocation policy weights for the Company’s
pension plans; asset class return forecasts from a large global independent asset management firm that specializes in
providing multi-asset class investment fund products which were blended together using the asset allocation policy
weights; and expected portfolio returns from a proprietary simulation methodology of a widely recognized external
investment consulting firm that performs asset allocation and actuarial services for corporate pension plan sponsors. This
same methodology has been applied on a consistent basis each year. All of these were consistent with the Company’s
weighted average long-term rate of return on plan assets assumption of 7.33% used for 2015 and 7.30% that will be
used for 2016. The assumption for the primary qualified employee plan is 7.75% and the employee-agent plan is 5.75%
for both years. The employee-agent plan assumption is lower than the primary qualified employee plan assumption due
to a lower investment allocation to equity securities and a higher allocation to fixed income securities. As of the 2015
measurement date, the arithmetic average of the annual actual return on plan assets for the most recent 10 and 5years
was 6.9% and 7.7%, respectively.
Cash flows
There was no required cash contribution necessary to satisfy the minimum funding requirement under the IRC for
the tax qualified pension plans as of December31, 2015. The Company currently plans to contribute $129 million to its
pension plans in 2016.
The Company contributed $35 million and $38 million to the postretirement benefit plans in 2015 and 2014,
respectively. Contributions by participants were $19 million and $19 million in 2015 and 2014, respectively.
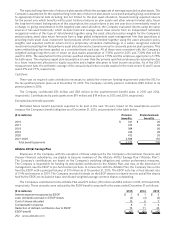
Estimated future benefit payments
Estimated future benefit payments expected to be paid in the next 10years, based on the assumptions used to
measure the Company’s benefit obligation as of December31, 2015, are presented in the table below.
($ in millions) Pension
benefits
Postretirement
benefits
2016 $ 341 $ 26
2017 372 26
2018 388 26
2019 436 28
2020 472 29
2021‑2025 2,569 155
Total benefit payments $ 4,578 $ 290
Allstate 401(k) Savings Plan
Employees of the Company, with the exception of those employed by the Company’s international, Esurance and
Answer Financial subsidiaries, are eligible to become members of the Allstate 401(k) Savings Plan (“Allstate Plan”).
The Company’s contributions are based on the Company’s matching obligation and certain performance measures.
The Company is responsible for funding its anticipated contribution to the Allstate Plan, and may, at the discretion of
management, use the ESOP to pre-fund certain portions. In connection with the Allstate Plan, the Company has a note
from the ESOP with a principal balance of $11 million as of December31, 2015. The ESOP note has a fixed interest rate
of 7.9% and matures in 2019. The Company records dividends on the ESOP shares in retained income and all the shares
held by the ESOP are included in basic and diluted weighted average common shares outstanding.
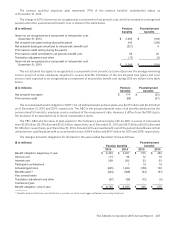
The Company’s contribution to the Allstate Plan was $79 million, $75 million and $54 million in 2015, 2014 and 2013,
respectively. These amounts were reduced by the ESOP benefit computed for the years ended December31 as follows:
($ in millions) 2015 2014 2013
Interest expense recognized by ESOP $ 1 $ 1 $ 2
Less: dividends accrued on ESOP shares (3) (4) (3)
Cost of shares allocated 10 8 7
Compensation expense 8 5 6
Reduction of defined contribution due to ESOP 73 71 46
ESOP benefit $ (65) $ (66) $ (40)