Allstate 2015 Annual Report Download - page 169
Download and view the complete annual report
Please find page 169 of the 2015 Allstate annual report below. You can navigate through the pages in the report by either clicking on the pages listed below, or by using the keyword search tool below to find specific information within the annual report.-
 1
1 -
2
-
3
-
4
-
5
-
6
-
7
-
8
-
9
-
10
-
11
-
12
-
13
-
14
-
15
-
16
-
17
-
18
-
19
-
20
-
21
-
22
-
23
-
24
-
25
-
26
-
27
-
28
-
29
-
30
-
31
-
32
-
33
-
34
-
35
-
36
-
37
-
38
-
39
-
40
-
41
-
42
-
43
-
44
-
45
-
46
-
47
-
48
-
49
-
50
-
51
-
52
-
53
-
54
-
55
-
56
-
57
-
58
-
59
-
60
-
61
-
62
-
63
-
64
-
65
-
66
-
67
-
68
-
69
-
70
-
71
-
72
-
73
-
74
-
75
-
76
-
77
-
78
-
79
-
80
-
81
-
82
-
83
-
84
-
85
-
86
-
87
-
88
-
89
-
90
-
91
-
92
-
93
-
94
-
95
-
96
-
97
-
98
-
99
-
100
-
101
-
102
-
103
-
104
-
105
-
106
-
107
-
108
-
109
-
110
-
111
-
112
-
113
-
114
-
115
-
116
-
117
-
118
-
119
-
120
-
121
-
122
-
123
-
124
-
125
-
126
-
127
-
128
-
129
-
130
-
131
-
132
-
133
-
134
-
135
-
136
-
137
-
138
-
139
-
140
-
141
-
142
-
143
-
144
-
145
-
146
-
147
-
148
-
149
-
150
-
151
-
152
-
153
-
154
-
155
-
156
-
157
-
158
-
 159
159 -
 160
160 -
 161
161 -
 162
162 -
 163
163 -
 164
164 -
 165
165 -
 166
166 -
 167
167 -
 168
168 -
 169
169 -
 170
170 -
 171
171 -
 172
172 -
 173
173 -
 174
174 -
 175
175 -
 176
176 -
 177
177 -
 178
178 -
 179
179 -
180
-
181
-
182
-
183
-
184
-
185
-
186
-
187
-
188
-
189
-
190
-
191
-
192
-
193
-
194
-
195
-
196
-
197
-
198
-
199
-
200
-
201
-
202
-
203
-
204
-
205
-
206
-
207
-
208
-
209
-
210
-
211
-
212
-
213
-
214
-
215
-
216
-
217
-
218
-
219
-
220
-
221
-
222
-
223
-
224
-
225
-
226
-
227
-
228
-
229
-
230
-
231
-
232
-
233
-
234
-
235
-
236
-
237
-
238
-
239
-
240
-
241
-
242
-
243
-
244
-
245
-
246
-
247
-
248
-
249
-
250
-
251
-
252
-
253
-
254
-
255
-
256
-
257
-
258
-
259
-
260
-
261
-
262
-
263
-
264
-
265
-
266
-
267
-
268
-
269
-
270
-
271
-
272
 |
 |

The Allstate Corporation 2015 Annual Report 163
and renewal premium for life policies, which may significantly impact both the timing and amount of future payments. Such cash outflows reflect
adjustments for the estimated timing of mortality, retirement, and other appropriate factors, but are undiscounted with respect to interest. As a
result, the sum of the cash outflows shown for all years in the table exceeds the corresponding liabilities of $21.30 billion for contractholder funds
and $12.25 billion for reserve for life-contingent contract benefits as included in the Consolidated Statements of Financial Position as of December
31, 2015. The liability amount in the Consolidated Statements of Financial Position reflects the discounting for interest as well as adjustments for the
timing of other factors as described above.
(3) Amount differs from the balance presented on the Consolidated Statements of Financial Position as of December 31, 2015 because the long-term
debt amount above includes interest and excludes debt issuance costs.
(4) Our payment obligations relating to capital lease obligations, operating leases, unconditional purchase obligations and pension and other
postretirement benefits (“OPEB”) contributions are managed within the structure of our intermediate to long-term liquidity management program.
(5) The pension plans’ obligations in the next 12 months represent our planned contributions where the benefit obligation exceeds the assets, and the
remaining years’ contributions are projected based on the average remaining service period using the current underfunded status of the plans. The
OPEB plans’ obligations are estimated based on the expected benefits to be paid. These liabilities are discounted with respect to interest, and as
a result the sum of the cash outflows shown for all years in the table exceeds the corresponding liability amount of $549 million included in other
liabilities and accrued expenses on the Consolidated Statements of Financial Position.
(6) Reserve for property-liability insurance claims and claims expense is an estimate of amounts necessary to settle all outstanding claims, including claims
that have been IBNR as of the balance sheet date. We have estimated the timing of these payments based on our historical experience and our expectation
of future payment patterns. However, the timing of these payments may vary significantly from the amounts shown above, especially for IBNR claims. The
ultimate cost of losses may vary materially from recorded amounts which are our best estimates. The reserve for property-liability insurance claims and
claims expense includes loss reserves related to asbestos and environmental claims as of December 31, 2015, of $1.42 billion and $222 million, respectively.
(7) Other liabilities primarily include accrued expenses and certain benefit obligations and claim payments and other checks outstanding. Certain of
these long-term liabilities are discounted with respect to interest, as a result the sum of the cash outflows shown for all years in the table exceeds
the corresponding liability amount by $7 million.
(8) Balance sheet liabilities not included in the table above include unearned and advance premiums of $12.99 billion and gross deferred tax liabilities of
$1.93 billion. These items were excluded as they do not meet the definition of a contractual liability as we are not contractually obligated to pay these
amounts to third parties. Rather, they represent an accounting mechanism that allows us to present our financial statements on an accrual basis. In
addition, other liabilities of $223 million were not included in the table above because they did not represent a contractual obligation or the amount
and timing of their eventual payment was sufficiently uncertain.
(9) Net unrecognized tax benefits represent our potential future obligation to the taxing authority for a tax position that was not recognized in the
consolidated financial statements. We believe it is reasonably possible that the liability balance will not significantly increase within the next twelve
months. The resolution of this obligation may be for an amount different than what we have accrued.
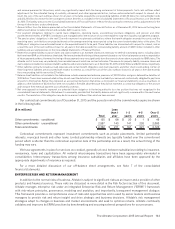
Our contractual commitments as of December 31, 2015 and the periods in which the commitments expire are shown
in the following table.
($ in millions)
Total
Less
than 1
year
1-3
years
4-5
years
Over 5
years
Other commitments – conditional $ 135 $ 68 $ 20 $ 1 $ 46
Other commitments – unconditional 2,587 143 141 220 2,083
Total commitments $ 2,722 $ 211 $ 161 $ 221 $ 2,129
Contractual commitments represent investment commitments such as private placements, limited partnership
interests, municipal bonds and other loans. Limited partnership interests are typically funded over the commitment
period which is shorter than the contractual expiration date of the partnership and as a result, the actual timing of the
funding may vary.
We have agreements in place for services we conduct, generally at cost, between subsidiaries relating to insurance,
reinsurance, loans and capitalization. All material intercompany transactions have been appropriately eliminated in
consolidation. Intercompany transactions among insurance subsidiaries and affiliates have been approved by the
appropriate departments of insurance as required.
For a more detailed discussion of our off-balance sheet arrangements, see Note 7 of the consolidated
financial statements.
ENTERPRISE RISK AND RETURN MANAGEMENT
In addition to the normal risks of business, Allstate is subject to significant risks as an insurer and a provider of other
products and financial services. These risks are discussed in more detail in the Risk Factors section of this document.
Allstate manages enterprise risk under an integrated Enterprise Risk and Return Management (“ERRM”) framework
with risk-return principles, governance, modeling and analytics, and importantly, transparent management dialogue.
This framework provides a comprehensive view of risks and opportunities and is used by senior leaders and business
managers to provide risk and return insight and drive strategic and business decisions. Allstate’s risk management
strategies adapt to changes in business and market environments and seek to optimize returns. Allstate continually
validates and improves its ERRM practices by benchmarking and securing external perspectives for our processes.