Allstate 2015 Annual Report Download - page 139
Download and view the complete annual report
Please find page 139 of the 2015 Allstate annual report below. You can navigate through the pages in the report by either clicking on the pages listed below, or by using the keyword search tool below to find specific information within the annual report.-
 1
1 -
2
-
3
-
4
-
5
-
6
-
7
-
8
-
9
-
10
-
11
-
12
-
13
-
14
-
15
-
16
-
17
-
18
-
19
-
20
-
21
-
22
-
23
-
24
-
25
-
26
-
27
-
28
-
29
-
30
-
31
-
32
-
33
-
34
-
35
-
36
-
37
-
38
-
39
-
40
-
41
-
42
-
43
-
44
-
45
-
46
-
47
-
48
-
49
-
50
-
51
-
52
-
53
-
54
-
55
-
56
-
57
-
58
-
59
-
60
-
61
-
62
-
63
-
64
-
65
-
66
-
67
-
68
-
69
-
70
-
71
-
72
-
73
-
74
-
75
-
76
-
77
-
78
-
79
-
80
-
81
-
82
-
83
-
84
-
85
-
86
-
87
-
88
-
89
-
90
-
91
-
92
-
93
-
94
-
95
-
96
-
97
-
98
-
99
-
100
-
101
-
102
-
103
-
104
-
105
-
106
-
107
-
108
-
109
-
110
-
111
-
112
-
113
-
114
-
115
-
116
-
117
-
118
-
119
-
120
-
121
-
122
-
123
-
124
-
125
-
126
-
127
-
128
-
 129
129 -
 130
130 -
 131
131 -
 132
132 -
 133
133 -
 134
134 -
 135
135 -
 136
136 -
 137
137 -
 138
138 -
 139
139 -
 140
140 -
 141
141 -
 142
142 -
 143
143 -
 144
144 -
 145
145 -
 146
146 -
 147
147 -
 148
148 -
 149
149 -
150
-
151
-
152
-
153
-
154
-
155
-
156
-
157
-
158
-
159
-
160
-
161
-
162
-
163
-
164
-
165
-
166
-
167
-
168
-
169
-
170
-
171
-
172
-
173
-
174
-
175
-
176
-
177
-
178
-
179
-
180
-
181
-
182
-
183
-
184
-
185
-
186
-
187
-
188
-
189
-
190
-
191
-
192
-
193
-
194
-
195
-
196
-
197
-
198
-
199
-
200
-
201
-
202
-
203
-
204
-
205
-
206
-
207
-
208
-
209
-
210
-
211
-
212
-
213
-
214
-
215
-
216
-
217
-
218
-
219
-
220
-
221
-
222
-
223
-
224
-
225
-
226
-
227
-
228
-
229
-
230
-
231
-
232
-
233
-
234
-
235
-
236
-
237
-
238
-
239
-
240
-
241
-
242
-
243
-
244
-
245
-
246
-
247
-
248
-
249
-
250
-
251
-
252
-
253
-
254
-
255
-
256
-
257
-
258
-
259
-
260
-
261
-
262
-
263
-
264
-
265
-
266
-
267
-
268
-
269
-
270
-
271
-
272
 |
 |

The Allstate Corporation 2015 Annual Report 133
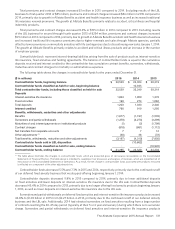
For further discussion of realized capital gains and losses, see the Investments section of the MD&A.
Analysis of costs and expenses Total costs and expenses decreased 3.3% or $114 million in 2015 compared to 2014.
Excluding results of the LBL business for first quarter 2014 of $168 million, total costs and expenses increased $54 million
in 2015 compared to 2014, primarily due to higher life and annuity contract benefits, partially offset by lower interest
credited to contractholder funds. Total costs and expenses decreased 16.7% or $683 million in 2014 compared to 2013.
Excluding results of the LBL business for second through fourth quarter 2013 of $475 million, total costs and expenses
decreased $208 million in 2014 compared to 2013, primarily due to lower interest credited to contractholder funds, lower
operating costs and expenses and lower amortization of DAC, partially offset by higher life and annuity contract benefits.
Life and annuity contract benefits increased 2.2% or $38 million in 2015 compared to 2014. Excluding results of the
LBL business for first quarter 2014 of $65 million, life and annuity contract benefits increased $103 million in 2015
compared to 2014, primarily due to unfavorable life insurance mortality experience and growth at Allstate Benefits. Our
2015 annual review of assumptions resulted in a $4 million increase in reserves primarily for secondary guarantees on
interest-sensitive life insurance due to higher than anticipated retention on guaranteed interest-sensitive life business.
Life and annuity contract benefits decreased 7.9% or $152 million in 2014 compared to 2013. Excluding results of
the LBL business for second through fourth quarter 2013 of $173 million, life and annuity contract benefits increased $21
million in 2014 compared to 2013, primarily due to worse mortality experience on life insurance and growth at Allstate
Benefits. Our 2014 annual review of assumptions resulted in an $11 million increase in reserves primarily for secondary
guarantees on interest-sensitive life insurance due to increased projected exposure to secondary guarantees.
We analyze our mortality and morbidity results using the difference between premiums and contract charges earned
for the cost of insurance and life and annuity contract benefits excluding the portion related to the implied interest on
immediate annuities with life contingencies (“benefit spread”). This implied interest totaled $511 million, $521 million
and $527 million in 2015, 2014 and 2013, respectively.
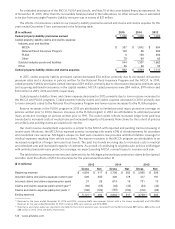
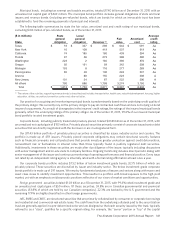
The benefit spread by product group for the years ended December 31 is disclosed in the following table.
($ in millions) 2015 2014 2013
Life insurance $ 250 $ 287 $ 301
Accident and health insurance (10) (8) (18)
Subtotal — Allstate Life 240 279 283
Life insurance 24 17 21
Accident and health insurance 396 397 356
Subtotal — Allstate Benefits 420 414 377
Allstate Annuities (80) (85) (77)
Total benefit spread $ 580 $ 608 $ 583
Benefit spread decreased 4.6% or $28 million in 2015 compared to 2014. Excluding results of the LBL business
for first quarter 2014 of $(1) million, benefit spread decreased $29 million in 2015 compared to 2014, primarily due to
unfavorable life insurance mortality experience, partially offset by higher life insurance premiums.
Benefit spread increased 4.3% or $25 million in 2014 compared to 2013. Excluding results of the LBL business for
second through fourth quarter 2013 of $11 million, benefit spread increased $36 million in 2014 compared to 2013,
primarily due to growth in Allstate Benefits accident and health insurance and higher premiums and cost of insurance
contract charges on life insurance, partially offset by worse mortality experience on life insurance and immediate
annuities.
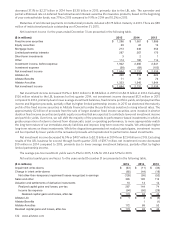
Interest credited to contractholder funds decreased 17.2% or $158 million in 2015 compared to 2014. Excluding results of
the LBL business for first quarter 2014 of $90 million, interest credited to contractholder funds decreased 8.2% or $68 million
in 2015 compared to 2014, primarily due to lower average contractholder funds and lower interest crediting rates. Interest
credited to contractholder funds decreased 28.1% or $359 million in 2014 compared to 2013. Excluding results of the LBL
business for second through fourth quarter 2013 of $270 million, interest credited to contractholder funds decreased $89
million in 2014 compared to 2013, primarily due to lower average contractholder funds and lower interest crediting rates.
Valuation changes on derivatives embedded in equity-indexed annuity contracts that are not hedged increased interest
credited to contractholder funds by $2 million in 2015 compared to $22 million in 2014 and $24 million in 2013.
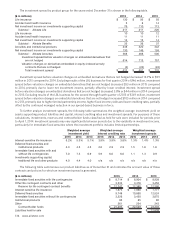
In order to analyze the impact of net investment income and interest credited to contractholders on net income, we
monitor the difference between net investment income and the sum of interest credited to contractholder funds and the
implied interest on immediate annuities with life contingencies, which is included as a component of life and annuity
contract benefits on the Consolidated Statements of Operations (“investment spread”).