Allstate 2015 Annual Report Download - page 242
Download and view the complete annual report
Please find page 242 of the 2015 Allstate annual report below. You can navigate through the pages in the report by either clicking on the pages listed below, or by using the keyword search tool below to find specific information within the annual report.-
 1
1 -
2
-
3
-
4
-
5
-
6
-
7
-
8
-
9
-
10
-
11
-
12
-
13
-
14
-
15
-
16
-
17
-
18
-
19
-
20
-
21
-
22
-
23
-
24
-
25
-
26
-
27
-
28
-
29
-
30
-
31
-
32
-
33
-
34
-
35
-
36
-
37
-
38
-
39
-
40
-
41
-
42
-
43
-
44
-
45
-
46
-
47
-
48
-
49
-
50
-
51
-
52
-
53
-
54
-
55
-
56
-
57
-
58
-
59
-
60
-
61
-
62
-
63
-
64
-
65
-
66
-
67
-
68
-
69
-
70
-
71
-
72
-
73
-
74
-
75
-
76
-
77
-
78
-
79
-
80
-
81
-
82
-
83
-
84
-
85
-
86
-
87
-
88
-
89
-
90
-
91
-
92
-
93
-
94
-
95
-
96
-
97
-
98
-
99
-
100
-
101
-
102
-
103
-
104
-
105
-
106
-
107
-
108
-
109
-
110
-
111
-
112
-
113
-
114
-
115
-
116
-
117
-
118
-
119
-
120
-
121
-
122
-
123
-
124
-
125
-
126
-
127
-
128
-
129
-
130
-
131
-
132
-
133
-
134
-
135
-
136
-
137
-
138
-
139
-
140
-
141
-
142
-
143
-
144
-
145
-
146
-
147
-
148
-
149
-
150
-
151
-
152
-
153
-
154
-
155
-
156
-
157
-
158
-
159
-
160
-
161
-
162
-
163
-
164
-
165
-
166
-
167
-
168
-
169
-
170
-
171
-
172
-
173
-
174
-
175
-
176
-
177
-
178
-
179
-
180
-
181
-
182
-
183
-
184
-
185
-
186
-
187
-
188
-
189
-
190
-
191
-
192
-
193
-
194
-
195
-
196
-
197
-
198
-
199
-
200
-
201
-
202
-
203
-
204
-
205
-
206
-
207
-
208
-
209
-
210
-
211
-
212
-
213
-
214
-
215
-
216
-
217
-
218
-
219
-
220
-
221
-
222
-
223
-
224
-
225
-
226
-
227
-
228
-
229
-
230
-
231
-
 232
232 -
 233
233 -
 234
234 -
 235
235 -
 236
236 -
 237
237 -
 238
238 -
 239
239 -
 240
240 -
 241
241 -
 242
242 -
 243
243 -
 244
244 -
 245
245 -
 246
246 -
 247
247 -
 248
248 -
 249
249 -
 250
250 -
 251
251 -
 252
252 -
253
-
254
-
255
-
256
-
257
-
258
-
259
-
260
-
261
-
262
-
263
-
264
-
265
-
266
-
267
-
268
-
269
-
270
-
271
-
272
 |
 |
236 www.allstate.com
by emergency assessments on all property and casualty premiums in the state, except workers’ compensation, medical
malpractice, accident and health insurance and policies written under the NFIP. The FHCF emergency assessments are
limited to 6% of premiums per year beginning the first year in which reimbursements require bonding, and up to a total
of 10% of premiums per year for assessments in the second and subsequent years, if required to fund additional bonding.
The FHCF issued $625 million in bonds in 2008, and the FL OIR ordered an emergency assessment of 1% of premiums
collected for all policies renewed January 1, 2007 through December 31, 2010. The FHCF issued $676 million in bonds in
2010 and the FL OIR ordered an emergency assessment of 1.3% of premiums collected for all policies written or renewed
January 1, 2011 through December 31, 2014. Pursuant to an Order issued by the FL OIR, the emergency assessment is
zero for all policies issued or renewed on or after January 1, 2015. The FHCF issued $2 billion in pre-event bonds in 2013
to build their capacity to reimburse member companies’ claims. The FHCF plans to fund these pre-event bonds through
current FHCF cash flows.
Facilities such as FL Citizens, LA Citizens and the FHCF are generally designed so that the ultimate cost is borne
by policyholders; however, the exposure to assessments from these facilities and the availability of recoupments or
premium rate increases may not offset each other in the Company’s financial statements. Moreover, even if they do
offset each other, they may not offset each other in financial statements for the same fiscal period due to the ultimate
timing of the assessments and recoupments or premium rate increases, as well as the possibility of policies not being
renewed in subsequent years.
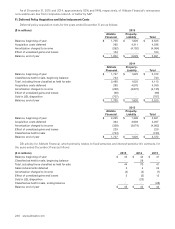
California Earthquake Authority
Exposure to certain potential losses from earthquakes in California is limited by the Company’s participation in the
California Earthquake Authority (“CEA”), which provides insurance for California earthquake losses. The CEA is a privately-
financed, publicly-managed state agency created to provide insurance coverage for earthquake damage. Insurers selling
homeowners insurance in California are required to offer earthquake insurance to their customers either through their
company or by participation in the CEA. The Company’s homeowners policies continue to include coverages for losses
caused by explosions, theft, glass breakage and fires following an earthquake, which are not underwritten by the CEA.
As of June 30, 2015, the CEA’s capital balance was approximately $4.88 billion. Should losses arising from an
earthquake cause a deficit in the CEA, additional $668 million would be obtained from the proceeds of revenue bonds the
CEA may issue, an existing $4.11 billion reinsurance layer, and finally, if needed, assessments on participating insurance
companies. Participating insurers are required to pay an assessment, currently estimated not to exceed $1.66 billion, if
the capital of the CEA falls below $350 million. Participating insurers are required to pay a second additional assessment,
currently estimated not to exceed $238 million, if aggregate CEA earthquake losses exceed $11.56 billion and the capital
of the CEA falls below $350 million. Within the limits previously described, the assessment could be intended to restore
the CEA’s capital to a level of $350 million. There is no provision that allows insurers to recover assessments through a
premium surcharge or other mechanism. The CEA’s projected aggregate claim paying capacity is $11.56 billion as of June
30, 2015 and if an event were to result in claims greater than its capacity, affected policyholders may be paid a prorated
portion of their covered losses, paid on an installment basis, or no payments may be made if the claim paying capacity
of the CEA is insufficient.
All future assessments on participating CEA insurers are based on their CEA insurance market share as of December
31 of the preceding year. As of December 31, 2014, the Company’s market share of the CEA was 13.1%. The Company does
not expect its CEA market share to materially change. At this level, the Company’s maximum possible CEA assessment
would be $248 million during 2016. These amounts are re-evaluated by the board of directors of the CEA on an annual
basis. Accordingly, assessments from the CEA for a particular quarter or annual period may be material to the results of
operations and cash flows, but not the financial position of the Company. Management believes the Company’s exposure
to earthquake losses in California has been significantly reduced as a result of its participation in the CEA.
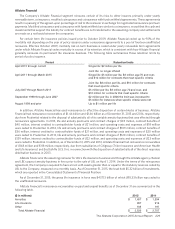
Texas Windstorm Insurance Association
The Company participates as a member of the Texas Windstorm Insurance Association (“TWIA”) which provides
wind and hail coverage to coastal risks unable to procure coverage in the voluntary market. Wind and hail coverage is
written on a TWIA-issued policy. Under current law, as amended in 2009, to the extent losses exceed premiums and
reinsurance, TWIA follows a funding structure first utilizing funds set aside from periods (including prior years) in which
premiums exceeded losses. Once those funds and available reinsurance are utilized, TWIA will issue up to $1 billion
of securities, 30% of which will be repaid by participating insurers assessments and 70% of which will be repaid by
surcharges on coastal property policies. After those funds are depleted, TWIA can issue $500 million of securities
which will be repaid by participating insurer assessments. Participating companies’ maximum assessment is capped at
$800 million annually. The Company’s current participation ratio is approximately 13% based upon its proportion of the