Allstate 2015 Annual Report Download - page 263
Download and view the complete annual report
Please find page 263 of the 2015 Allstate annual report below. You can navigate through the pages in the report by either clicking on the pages listed below, or by using the keyword search tool below to find specific information within the annual report.-
 1
1 -
2
-
3
-
4
-
5
-
6
-
7
-
8
-
9
-
10
-
11
-
12
-
13
-
14
-
15
-
16
-
17
-
18
-
19
-
20
-
21
-
22
-
23
-
24
-
25
-
26
-
27
-
28
-
29
-
30
-
31
-
32
-
33
-
34
-
35
-
36
-
37
-
38
-
39
-
40
-
41
-
42
-
43
-
44
-
45
-
46
-
47
-
48
-
49
-
50
-
51
-
52
-
53
-
54
-
55
-
56
-
57
-
58
-
59
-
60
-
61
-
62
-
63
-
64
-
65
-
66
-
67
-
68
-
69
-
70
-
71
-
72
-
73
-
74
-
75
-
76
-
77
-
78
-
79
-
80
-
81
-
82
-
83
-
84
-
85
-
86
-
87
-
88
-
89
-
90
-
91
-
92
-
93
-
94
-
95
-
96
-
97
-
98
-
99
-
100
-
101
-
102
-
103
-
104
-
105
-
106
-
107
-
108
-
109
-
110
-
111
-
112
-
113
-
114
-
115
-
116
-
117
-
118
-
119
-
120
-
121
-
122
-
123
-
124
-
125
-
126
-
127
-
128
-
129
-
130
-
131
-
132
-
133
-
134
-
135
-
136
-
137
-
138
-
139
-
140
-
141
-
142
-
143
-
144
-
145
-
146
-
147
-
148
-
149
-
150
-
151
-
152
-
153
-
154
-
155
-
156
-
157
-
158
-
159
-
160
-
161
-
162
-
163
-
164
-
165
-
166
-
167
-
168
-
169
-
170
-
171
-
172
-
173
-
174
-
175
-
176
-
177
-
178
-
179
-
180
-
181
-
182
-
183
-
184
-
185
-
186
-
187
-
188
-
189
-
190
-
191
-
192
-
193
-
194
-
195
-
196
-
197
-
198
-
199
-
200
-
201
-
202
-
203
-
204
-
205
-
206
-
207
-
208
-
209
-
210
-
211
-
212
-
213
-
214
-
215
-
216
-
217
-
218
-
219
-
220
-
221
-
222
-
223
-
224
-
225
-
226
-
227
-
228
-
229
-
230
-
231
-
232
-
233
-
234
-
235
-
236
-
237
-
238
-
239
-
240
-
241
-
242
-
243
-
244
-
245
-
246
-
247
-
248
-
249
-
250
-
251
-
252
-
 253
253 -
 254
254 -
 255
255 -
 256
256 -
 257
257 -
 258
258 -
 259
259 -
 260
260 -
 261
261 -
 262
262 -
 263
263 -
 264
264 -
 265
265 -
 266
266 -
 267
267 -
 268
268 -
 269
269 -
 270
270 -
 271
271 -
 272
272
 |
 |

The Allstate Corporation 2015 Annual Report 257
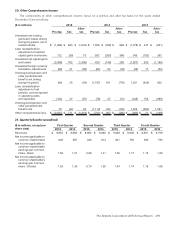
Summarized financial performance data for each of the Company’s reportable segments for the years ended
December31 are as follows:
($ in millions) 2015 2014 2013
Net income
Property-Liability
Underwriting income
Allstate Protection $ 1,614 $ 1,887 $ 2,361
Discontinued Lines and Coverages (55) (115) (143)
Total underwriting income 1,559 1,772 2,218
Net investment income 1,237 1,301 1,375
Income tax expense on operations (1) (952) (1,040) (1,177)
Realized capital gains and losses, after‑tax (154) 357 339
Gain (loss) on disposition of operations, after‑tax — 37 (1)
Property‑Liability net income applicable to common shareholders 1,690 2,427 2,754
Allstate Financial
Life and annuity premiums and contract charges 2,158 2,157 2,352
Net investment income 1,884 2,131 2,538
Periodic settlements and accruals on non‑hedge derivative instruments — (1) 17
Contract benefits and interest credited to contractholder funds (2,563) (2,663) (3,171)
Operating costs and expenses and amortization of deferred policy acquisition costs (729) (721) (895)
Restructuring and related charges — (2) (7)
Income tax expense on operations (241) (294) (246)
Operating income 509 607 588
Realized capital gains and losses, after‑tax 173 94 46
Valuation changes on embedded derivatives that are not hedged, after‑tax (1) (15) (16)
DAC and DSI amortization related to realized capital gains and losses and valuation
changes on embedded derivatives that are not hedged, after‑tax
(3) (3) (5)
DAC and DSI unlocking related to realized capital gains and losses, after‑tax — — 7
Reclassification of periodic settlements and accruals on non‑hedge derivative
instruments, after‑tax — 1 (11)
Gain (loss) on disposition of operations, after‑tax 2 (53) (514)
Change in accounting for investments in qualified affordable housing projects, after‑tax (17) — —
Allstate Financial net income applicable to common shareholders 663 631 95
Corporate and Other
Service fees (2) 359
Net investment income 35 27 30
Operating costs and expenses (2) (329) (364) (627)
Income tax benefit on operations 109 124 220
Preferred stock dividends (116) (104) (17)
Operating loss (298) (312) (385)
Realized capital gains and losses, after‑tax — — —
Loss on extinguishment of debt, after‑tax — — (319)
Postretirement benefits curtailment gain, after‑tax — — 118
Corporate and Other net loss applicable to common shareholders (298) (312) (586)
Consolidated net income applicable to common shareholders $ 2,055 $ 2,746 $ 2,263
(1) Income tax on operations for Property-Liability segment includes $28 million of expense related to the change in accounting guidance for investments
in qualified affordable housing projects adopted in 2015.
(2) For presentation in the Consolidated Statements of Operations, service fees of the Corporate and Other segment are reclassified to operating costs
and expenses.