Allstate 2015 Annual Report Download - page 142
Download and view the complete annual report
Please find page 142 of the 2015 Allstate annual report below. You can navigate through the pages in the report by either clicking on the pages listed below, or by using the keyword search tool below to find specific information within the annual report.-
 1
1 -
2
-
3
-
4
-
5
-
6
-
7
-
8
-
9
-
10
-
11
-
12
-
13
-
14
-
15
-
16
-
17
-
18
-
19
-
20
-
21
-
22
-
23
-
24
-
25
-
26
-
27
-
28
-
29
-
30
-
31
-
32
-
33
-
34
-
35
-
36
-
37
-
38
-
39
-
40
-
41
-
42
-
43
-
44
-
45
-
46
-
47
-
48
-
49
-
50
-
51
-
52
-
53
-
54
-
55
-
56
-
57
-
58
-
59
-
60
-
61
-
62
-
63
-
64
-
65
-
66
-
67
-
68
-
69
-
70
-
71
-
72
-
73
-
74
-
75
-
76
-
77
-
78
-
79
-
80
-
81
-
82
-
83
-
84
-
85
-
86
-
87
-
88
-
89
-
90
-
91
-
92
-
93
-
94
-
95
-
96
-
97
-
98
-
99
-
100
-
101
-
102
-
103
-
104
-
105
-
106
-
107
-
108
-
109
-
110
-
111
-
112
-
113
-
114
-
115
-
116
-
117
-
118
-
119
-
120
-
121
-
122
-
123
-
124
-
125
-
126
-
127
-
128
-
129
-
130
-
131
-
 132
132 -
 133
133 -
 134
134 -
 135
135 -
 136
136 -
 137
137 -
 138
138 -
 139
139 -
 140
140 -
 141
141 -
 142
142 -
 143
143 -
 144
144 -
 145
145 -
 146
146 -
 147
147 -
 148
148 -
 149
149 -
 150
150 -
 151
151 -
 152
152 -
153
-
154
-
155
-
156
-
157
-
158
-
159
-
160
-
161
-
162
-
163
-
164
-
165
-
166
-
167
-
168
-
169
-
170
-
171
-
172
-
173
-
174
-
175
-
176
-
177
-
178
-
179
-
180
-
181
-
182
-
183
-
184
-
185
-
186
-
187
-
188
-
189
-
190
-
191
-
192
-
193
-
194
-
195
-
196
-
197
-
198
-
199
-
200
-
201
-
202
-
203
-
204
-
205
-
206
-
207
-
208
-
209
-
210
-
211
-
212
-
213
-
214
-
215
-
216
-
217
-
218
-
219
-
220
-
221
-
222
-
223
-
224
-
225
-
226
-
227
-
228
-
229
-
230
-
231
-
232
-
233
-
234
-
235
-
236
-
237
-
238
-
239
-
240
-
241
-
242
-
243
-
244
-
245
-
246
-
247
-
248
-
249
-
250
-
251
-
252
-
253
-
254
-
255
-
256
-
257
-
258
-
259
-
260
-
261
-
262
-
263
-
264
-
265
-
266
-
267
-
268
-
269
-
270
-
271
-
272
 |
 |

136 www.allstate.com
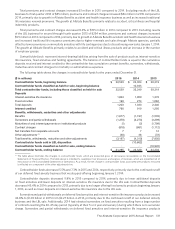
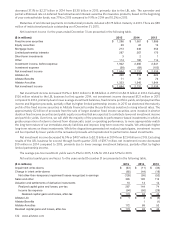
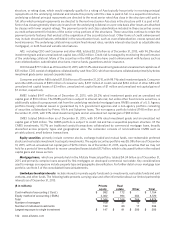
The changes in DAC for the years ended December 31 are detailed in the following table.
($ in millions) Traditional life
and accident
and health
Interest-sensitive
life insurance
Fixed
annuities Total
2015 2014 2015 2014 2015 2014 2015 2014
Balance, beginning of year $ 753 $ 711 $ 905 $ 991 $ 47 $ 45 $ 1,705 $ 1,747
Classified as held for sale, beginning balance — 13 — 700 — 30 — 743
Total, including those classified as held for sale 753 724 905 1,691 47 75 1,705 2,490
Acquisition costs deferred 178 167 107 113 — — 285 280
Amortization of DAC before amortization relating
to realized capital gains and losses, valuation
changes on embedded derivatives that are not
hedged and changes in assumptions (1) (139) (125) (111) (130) (6) (8) (256) (263)
Amortization relating to realized capital gains and
losses and valuation changes on embedded
derivatives that are not hedged (1) — — (6) (8) 1 3 (5) (5)
Amortization (acceleration) deceleration for changes
in assumptions (“DAC unlocking”) (1) — — (1) 10 — (2) (1) 8
Effect of unrealized capital gains and losses (2) — — 99 (97) 5 (1) 104 (98)
Sold in LBL disposition — (13) — (674) — (20) — (707)
Ending balance $ 792 $ 753 $ 993 $ 905 $ 47 $ 47 $ 1,832 $ 1,705
(1) Included as a component of amortization of DAC on the Consolidated Statements of Operations.
(2) Represents the change in the DAC adjustment for unrealized capital gains and losses. The DAC adjustment represents the amount by which the
amortization of DAC would increase or decrease if the unrealized gains and losses in the respective product portfolios were realized.
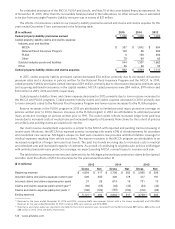
Operating costs and expenses increased 1.3% or $6 million in 2015 compared to 2014. Excluding results of the LBL
business for first quarter 2014 of $8 million, operating costs and expenses increased $14 million in 2015 compared to
2014. Operating costs and expenses decreased 17.5% or $99 million in 2014 compared to 2013. Excluding results of the
LBL business for second through fourth quarter 2013 of $31 million, operating costs and expenses decreased $68 million
in 2014 compared to 2013.
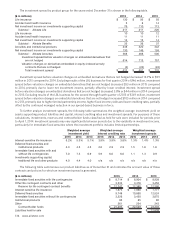
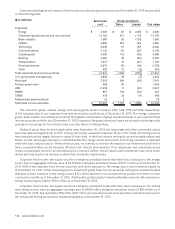
The following table summarizes operating costs and expenses for the years ended December 31.
($ in millions) 2015 2014 2013
Non‑deferrable commissions $ 95 $ 99 $ 103
General and administrative expenses 325 314 398
Taxes and licenses 52 53 64
Total operating costs and expenses $ 472 $ 466 $ 565
Restructuring and related charges $ — $ 2 $ 7
Allstate Life $ 212 $ 232 $ 282
Allstate Benefits 222 206 199
Allstate Annuities 38 28 84
Total operating costs and expenses $ 472 $ 466 $ 565
General and administrative expenses increased 3.5% or $11 million in 2015 compared to 2014, primarily due to
increased expenses at Allstate Benefits relating to employee costs, reinsurance expense allowances paid to LBL for
business reinsured to Allstate Life Insurance Company (“ALIC”) after the sale, and a guaranty fund accrual release in the
prior year period, partially offset by lower technology costs.
General and administrative expenses decreased 21.1% or $84 million in 2014 compared to 2013, primarily due to
actions to improve strategic focus and modernize the operating model. This included the sale of LBL, exiting the master
brokerage agency distribution channel, discontinuing sales of proprietary annuity products, and other rightsizing and
profitability actions.
Income tax expense included $17 million related to our adoption of new accounting guidance for investments in
qualified affordable housing projects in first quarter 2015.
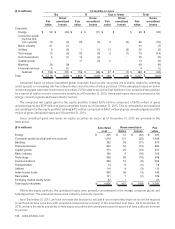
Reinsurance ceded In the normal course of business, we seek to limit aggregate and single exposure to losses on
large risks by purchasing reinsurance. In addition, Allstate Financial has used reinsurance to effect the disposition of
certain blocks of business. We retain primary liability as a direct insurer for all risks ceded to reinsurers. As of December
31, 2015 and 2014, 21% and 23%, respectively, of our face amount of life insurance in force was reinsured. Additionally,
we ceded substantially all of the risk associated with our variable annuity business.