Allstate 2015 Annual Report Download - page 148
Download and view the complete annual report
Please find page 148 of the 2015 Allstate annual report below. You can navigate through the pages in the report by either clicking on the pages listed below, or by using the keyword search tool below to find specific information within the annual report.-
 1
1 -
2
-
3
-
4
-
5
-
6
-
7
-
8
-
9
-
10
-
11
-
12
-
13
-
14
-
15
-
16
-
17
-
18
-
19
-
20
-
21
-
22
-
23
-
24
-
25
-
26
-
27
-
28
-
29
-
30
-
31
-
32
-
33
-
34
-
35
-
36
-
37
-
38
-
39
-
40
-
41
-
42
-
43
-
44
-
45
-
46
-
47
-
48
-
49
-
50
-
51
-
52
-
53
-
54
-
55
-
56
-
57
-
58
-
59
-
60
-
61
-
62
-
63
-
64
-
65
-
66
-
67
-
68
-
69
-
70
-
71
-
72
-
73
-
74
-
75
-
76
-
77
-
78
-
79
-
80
-
81
-
82
-
83
-
84
-
85
-
86
-
87
-
88
-
89
-
90
-
91
-
92
-
93
-
94
-
95
-
96
-
97
-
98
-
99
-
100
-
101
-
102
-
103
-
104
-
105
-
106
-
107
-
108
-
109
-
110
-
111
-
112
-
113
-
114
-
115
-
116
-
117
-
118
-
119
-
120
-
121
-
122
-
123
-
124
-
125
-
126
-
127
-
128
-
129
-
130
-
131
-
132
-
133
-
134
-
135
-
136
-
137
-
 138
138 -
 139
139 -
 140
140 -
 141
141 -
 142
142 -
 143
143 -
 144
144 -
 145
145 -
 146
146 -
 147
147 -
 148
148 -
 149
149 -
 150
150 -
 151
151 -
 152
152 -
 153
153 -
 154
154 -
 155
155 -
 156
156 -
 157
157 -
 158
158 -
159
-
160
-
161
-
162
-
163
-
164
-
165
-
166
-
167
-
168
-
169
-
170
-
171
-
172
-
173
-
174
-
175
-
176
-
177
-
178
-
179
-
180
-
181
-
182
-
183
-
184
-
185
-
186
-
187
-
188
-
189
-
190
-
191
-
192
-
193
-
194
-
195
-
196
-
197
-
198
-
199
-
200
-
201
-
202
-
203
-
204
-
205
-
206
-
207
-
208
-
209
-
210
-
211
-
212
-
213
-
214
-
215
-
216
-
217
-
218
-
219
-
220
-
221
-
222
-
223
-
224
-
225
-
226
-
227
-
228
-
229
-
230
-
231
-
232
-
233
-
234
-
235
-
236
-
237
-
238
-
239
-
240
-
241
-
242
-
243
-
244
-
245
-
246
-
247
-
248
-
249
-
250
-
251
-
252
-
253
-
254
-
255
-
256
-
257
-
258
-
259
-
260
-
261
-
262
-
263
-
264
-
265
-
266
-
267
-
268
-
269
-
270
-
271
-
272
 |
 |

142 www.allstate.com
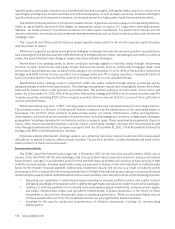
structure, or rating class, which would originally qualify for a rating of Aaa typically has priority in receiving principal
repayments on the underlying collateral and retains this priority until the class is paid in full. In a sequential structure,
underlying collateral principal repayments are directed to the most senior rated Aaa class in the structure until paid in
full, after which principal repayments are directed to the next most senior Aaa class in the structure until it is paid in full.
Senior Aaa classes generally share any losses from the underlying collateral on a pro-rata basis after losses are absorbed
by classes with lower original ratings. The payment priority and class subordination included in these securities serves
as credit enhancement for holders of the senior or top portions of the structures. These securities continue to retain the
payment priority features that existed at the origination of the securitization trust. Other forms of credit enhancement
may include structural features embedded in the securitization trust, such as overcollateralization, excess spread and
bond insurance. The underlying collateral may contain fixed interest rates, variable interest rates (such as adjustable rate
mortgages), or both fixed and variable rate features.
ABS, including CDO and Consumer and other ABS, totaled $2.33 billion as of December 31, 2015, with 96.2% rated
investment grade and an unrealized net capital loss of $32 million. Credit risk is managed by monitoring the performance
of the underlying collateral. Many of the securities in the ABS portfolio have credit enhancement with features such as
overcollateralization, subordinated structures, reserve funds, guarantees and/or insurance.
CDO totaled $777 million as of December 31, 2015, with 91.2% rated investment grade and an unrealized net capital loss of
$35 million. CDO consist of obligations collateralized by cash flow CDO, which are structures collateralized primarily by below
investment grade senior secured corporate loans.
Consumer and other ABS totaled $1.55 billion as of December 31, 2015, with 98.7% rated investment grade. Consumer
and other ABS consists of $819 million of consumer auto, $497 million of credit card and $234 million of other ABS with
unrealized net capital losses of $3 million, unrealized net capital losses of $1 million and unrealized net capital gains of
$7 million, respectively.
RMBS totaled $947 million as of December 31, 2015, with 28.2% rated investment grade and an unrealized net
capital gain of $90 million. The RMBS portfolio is subject to interest rate risk, but unlike other fixed income securities, is
additionally subject to prepayment risk from the underlying residential mortgage loans. RMBS consists of a U.S. Agency
portfolio having collateral issued or guaranteed by U.S. government agencies and a non-agency portfolio consisting
of securities collateralized by Prime, Alt-A and Subprime loans. The non-agency portfolio totaled $748 million as of
December 31, 2015, with 9.1% rated investment grade and an unrealized net capital gain of $83 million.
CMBS totaled $466 million as of December 31, 2015, with 50.4% rated investment grade and an unrealized net
capital gain of $28 million. The CMBS portfolio is subject to credit risk and has a sequential paydown structure. Of the
CMBS investments, 95.7% are traditional conduit transactions collateralized by commercial mortgage loans, broadly
diversified across property types and geographical area. The remainder consists of non-traditional CMBS such as
privately placed, small balance transactions.
Equity securities primarily include common stocks, exchange traded and mutual funds, non-redeemable preferred
stocks and real estate investment trust equity investments. The equity securities portfolio was $5.08 billion as of December
31, 2015, with an unrealized net capital gain of $276 million. As of December 31, 2015, equity securities that we may not
hold for a period of time sufficient to recover unrealized losses totaled $1.7 billion, which is discussed further in the realized
capital gains and losses section.
Mortgage loans, which are primarily held in the Allstate Financial portfolio, totaled $4.34 billion as of December 31,
2015 and primarily comprise loans secured by first mortgages on developed commercial real estate. Key considerations
used to manage our exposure include property type and geographic diversification. For further detail on our mortgage loan
portfolio, see Note 5 of the consolidated financial statements.
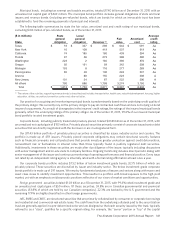
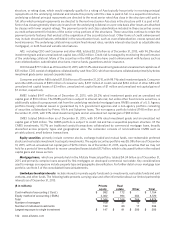
Limited partnership interests include interests in private equity funds and co-investments, real estate funds and joint
ventures, and other funds. The following table presents carrying value and other information about our limited partnership
interests as of December 31, 2015.
($ in millions) Private
equity
Real
estate Other Total
Cost method of accounting (“Cost”) $ 982 $ 172 $ — $ 1,154
Equity method of accounting (“EMA”) 2,362 994 364 3,720
Total $ 3,344 $ 1,166 $ 364 $ 4,874
Number of managers 108 37 12 157
Number of individual investments 199 80 17 296
Largest exposure to single investment $ 147 $ 81 $ 206 $ 206