Allstate 2015 Annual Report Download - page 205
Download and view the complete annual report
Please find page 205 of the 2015 Allstate annual report below. You can navigate through the pages in the report by either clicking on the pages listed below, or by using the keyword search tool below to find specific information within the annual report.-
 1
1 -
2
-
3
-
4
-
5
-
6
-
7
-
8
-
9
-
10
-
11
-
12
-
13
-
14
-
15
-
16
-
17
-
18
-
19
-
20
-
21
-
22
-
23
-
24
-
25
-
26
-
27
-
28
-
29
-
30
-
31
-
32
-
33
-
34
-
35
-
36
-
37
-
38
-
39
-
40
-
41
-
42
-
43
-
44
-
45
-
46
-
47
-
48
-
49
-
50
-
51
-
52
-
53
-
54
-
55
-
56
-
57
-
58
-
59
-
60
-
61
-
62
-
63
-
64
-
65
-
66
-
67
-
68
-
69
-
70
-
71
-
72
-
73
-
74
-
75
-
76
-
77
-
78
-
79
-
80
-
81
-
82
-
83
-
84
-
85
-
86
-
87
-
88
-
89
-
90
-
91
-
92
-
93
-
94
-
95
-
96
-
97
-
98
-
99
-
100
-
101
-
102
-
103
-
104
-
105
-
106
-
107
-
108
-
109
-
110
-
111
-
112
-
113
-
114
-
115
-
116
-
117
-
118
-
119
-
120
-
121
-
122
-
123
-
124
-
125
-
126
-
127
-
128
-
129
-
130
-
131
-
132
-
133
-
134
-
135
-
136
-
137
-
138
-
139
-
140
-
141
-
142
-
143
-
144
-
145
-
146
-
147
-
148
-
149
-
150
-
151
-
152
-
153
-
154
-
155
-
156
-
157
-
158
-
159
-
160
-
161
-
162
-
163
-
164
-
165
-
166
-
167
-
168
-
169
-
170
-
171
-
172
-
173
-
174
-
175
-
176
-
177
-
178
-
179
-
180
-
181
-
182
-
183
-
184
-
185
-
186
-
187
-
188
-
189
-
190
-
191
-
192
-
193
-
194
-
 195
195 -
 196
196 -
 197
197 -
 198
198 -
 199
199 -
 200
200 -
 201
201 -
 202
202 -
 203
203 -
 204
204 -
 205
205 -
 206
206 -
 207
207 -
 208
208 -
 209
209 -
 210
210 -
 211
211 -
 212
212 -
 213
213 -
 214
214 -
 215
215 -
216
-
217
-
218
-
219
-
220
-
221
-
222
-
223
-
224
-
225
-
226
-
227
-
228
-
229
-
230
-
231
-
232
-
233
-
234
-
235
-
236
-
237
-
238
-
239
-
240
-
241
-
242
-
243
-
244
-
245
-
246
-
247
-
248
-
249
-
250
-
251
-
252
-
253
-
254
-
255
-
256
-
257
-
258
-
259
-
260
-
261
-
262
-
263
-
264
-
265
-
266
-
267
-
268
-
269
-
270
-
271
-
272
 |
 |

The Allstate Corporation 2015 Annual Report 199
and implications of rating agency actions and offering prices; 2) the specific reasons that a security is in an unrealized
loss position, including overall market conditions which could affect liquidity; and 3) the length of time and extent to
which the fair value has been less than amortized cost or cost.
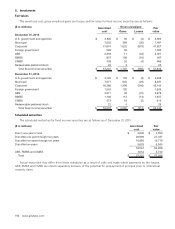
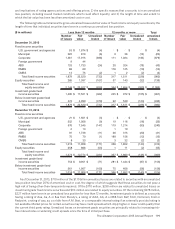
The following table summarizes the gross unrealized losses and fair value of fixed income and equity securities by the
length of time that individual securities have been in a continuous unrealized loss position.
($ in millions) Less than 12 months 12 months or more Total
unrealized
losses
Number
of issues
Fair
value
Unrealized
losses
Number
of issues
Fair
value
Unrealized
losses
December 31, 2015
Fixed income securities
U.S. government and agencies 53 $ 1,874 $ (4) — $ — $ — $ (4)
Municipal 222 810 (6) 9 36 (14) (20)
Corporate 1,361 17,915 (696) 111 1,024 (183) (879)
Foreign government 9 44 — — — — —
ABS 133 1,733 (24) 20 324 (19) (43)
RMBS 88 69 — 176 125 (10) (10)
CMBS 13 75 (2) 1 2 (2) (4)
Total fixed income securities 1,879 22,520 (732) 317 1,511 (228) (960)
Equity securities 265 1,397 (107) 37 143 (32) (139)
Total fixed income and
equity securities 2,144 $ 23,917 $ (839) 354 $ 1,654 $ (260) $ (1,099)
Investment grade fixed
income securities 1,405 $ 17,521 $ (362) 225 $ 972 $ (105) $ (467)
Below investment grade fixed
income securities 474 4,999 (370) 92 539 (123) (493)
Total fixed income securities 1,879 $ 22,520 $ (732) 317 $ 1,511 $ (228) $ (960)
December 31, 2014
Fixed income securities
U.S. government and agencies 21 $ 1,501 $ (3) — $ — $ — $ (3)
Municipal 252 1,008 (9) 19 116 (16) (25)
Corporate 576 7,545 (147) 119 1,214 (93) (240)
Foreign government 2 13 — 1 19 — —
ABS 81 1,738 (11) 26 315 (20) (31)
RMBS 75 70 (1) 188 156 (12) (13)
CMBS 8 33 — 3 32 (2) (2)
Total fixed income securities 1,015 11,908 (171) 356 1,852 (143) (314)
Equity securities 258 866 (53) 1 11 (2) (55)
Total fixed income and
equity securities 1,273 $ 12,774 $ (224) 357 $ 1,863 $ (145) $ (369)
Investment grade fixed
income securities 754 $ 9,951 $ (71) 281 $ 1,444 $ (87) $ (158)
Below investment grade fixed
income securities 261 1,957 (100) 75 408 (56) (156)
Total fixed income securities 1,015 $ 11,908 $ (171) 356 $ 1,852 $ (143) $ (314)
As of December 31, 2015, $710 million of the $1.10 billion unrealized losses are related to securities with an unrealized
loss position less than 20% of amortized cost or cost, the degree of which suggests that these securities do not pose a
high risk of being other-than-temporarily impaired. Of the $710 million, $338 million are related to unrealized losses on
investment grade fixed income securities and $94 million are related to equity securities. Of the remaining $278 million,
$227 million have been in an unrealized loss position for less than 12 months. Investment grade is defined as a security
having a rating of Aaa, Aa, A or Baa from Moody’s, a rating of AAA, AA, A or BBB from S&P, Fitch, Dominion, Kroll or
Realpoint, a rating of aaa, aa, a or bbb from A.M. Best, or a comparable internal rating if an externally provided rating is
not available. Market prices for certain securities may have credit spreads which imply higher or lower credit quality than
the current third party rating. Unrealized losses on investment grade securities are principally related to increasing risk-
free interest rates or widening credit spreads since the time of initial purchase.