Allstate 2015 Annual Report Download - page 186
Download and view the complete annual report
Please find page 186 of the 2015 Allstate annual report below. You can navigate through the pages in the report by either clicking on the pages listed below, or by using the keyword search tool below to find specific information within the annual report.-
 1
1 -
2
-
3
-
4
-
5
-
6
-
7
-
8
-
9
-
10
-
11
-
12
-
13
-
14
-
15
-
16
-
17
-
18
-
19
-
20
-
21
-
22
-
23
-
24
-
25
-
26
-
27
-
28
-
29
-
30
-
31
-
32
-
33
-
34
-
35
-
36
-
37
-
38
-
39
-
40
-
41
-
42
-
43
-
44
-
45
-
46
-
47
-
48
-
49
-
50
-
51
-
52
-
53
-
54
-
55
-
56
-
57
-
58
-
59
-
60
-
61
-
62
-
63
-
64
-
65
-
66
-
67
-
68
-
69
-
70
-
71
-
72
-
73
-
74
-
75
-
76
-
77
-
78
-
79
-
80
-
81
-
82
-
83
-
84
-
85
-
86
-
87
-
88
-
89
-
90
-
91
-
92
-
93
-
94
-
95
-
96
-
97
-
98
-
99
-
100
-
101
-
102
-
103
-
104
-
105
-
106
-
107
-
108
-
109
-
110
-
111
-
112
-
113
-
114
-
115
-
116
-
117
-
118
-
119
-
120
-
121
-
122
-
123
-
124
-
125
-
126
-
127
-
128
-
129
-
130
-
131
-
132
-
133
-
134
-
135
-
136
-
137
-
138
-
139
-
140
-
141
-
142
-
143
-
144
-
145
-
146
-
147
-
148
-
149
-
150
-
151
-
152
-
153
-
154
-
155
-
156
-
157
-
158
-
159
-
160
-
161
-
162
-
163
-
164
-
165
-
166
-
167
-
168
-
169
-
170
-
171
-
172
-
173
-
174
-
175
-
 176
176 -
 177
177 -
 178
178 -
 179
179 -
 180
180 -
 181
181 -
 182
182 -
 183
183 -
 184
184 -
 185
185 -
 186
186 -
 187
187 -
 188
188 -
 189
189 -
 190
190 -
 191
191 -
 192
192 -
 193
193 -
 194
194 -
 195
195 -
 196
196 -
197
-
198
-
199
-
200
-
201
-
202
-
203
-
204
-
205
-
206
-
207
-
208
-
209
-
210
-
211
-
212
-
213
-
214
-
215
-
216
-
217
-
218
-
219
-
220
-
221
-
222
-
223
-
224
-
225
-
226
-
227
-
228
-
229
-
230
-
231
-
232
-
233
-
234
-
235
-
236
-
237
-
238
-
239
-
240
-
241
-
242
-
243
-
244
-
245
-
246
-
247
-
248
-
249
-
250
-
251
-
252
-
253
-
254
-
255
-
256
-
257
-
258
-
259
-
260
-
261
-
262
-
263
-
264
-
265
-
266
-
267
-
268
-
269
-
270
-
271
-
272
 |
 |

180 www.allstate.com
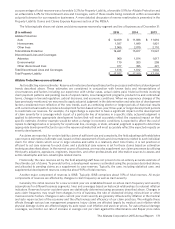
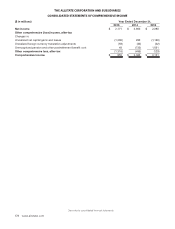
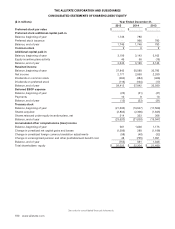
See notes to consolidated financial statements.
THE ALLSTATE CORPORATION AND SUBSIDIARIES
CONSOLIDATED STATEMENTS OF SHAREHOLDERS’ EQUITY
($ in millions) Year Ended December 31,
2015 2014 2013
Preferred stock par value $ — $ — $ —
Preferred stock additional capital paid-in
Balance, beginning of year 1,746 780 —
Preferred stock issuance — 966 780
Balance, end of year 1,746 1,746 780
Common stock 999
Additional capital paid-in
Balance, beginning of year 3,199 3,143 3,162
Equity incentive plans activity 46 56 (19)
Balance, end of year 3,245 3,199 3,143
Retained income
Balance, beginning of year 37,842 35,580 33,783
Net income 2,171 2,850 2,280
Dividends on common stock (484) (484) (466)
Dividends on preferred stock (116) (104) (17)
Balance, end of year 39,413 37,842 35,580
Deferred ESOP expense
Balance, beginning of year (23) (31) (41)
Payments 10 8 10
Balance, end of year (13) (23) (31)
Treasury stock
Balance, beginning of year (21,030) (19,047) (17,508)
Shares acquired (2,804) (2,306) (1,845)
Shares reissued under equity incentive plans, net 214 323 306
Balance, end of year (23,620) (21,030) (19,047)
Accumulated other comprehensive (loss) income
Balance, beginning of year 561 1,046 1,175
Change in unrealized net capital gains and losses (1,306) 280 (1,188)
Change in unrealized foreign currency translation adjustments (58) (40) (32)
Change in unrecognized pension and other postretirement benefit cost 48 (725) 1,091
Balance, end of year (755) 561 1,046
Total shareholders’ equity $ 20,025 $ 22,304 $ 21,480