Allstate 2015 Annual Report Download - page 174
Download and view the complete annual report
Please find page 174 of the 2015 Allstate annual report below. You can navigate through the pages in the report by either clicking on the pages listed below, or by using the keyword search tool below to find specific information within the annual report.-
 1
1 -
2
-
3
-
4
-
5
-
6
-
7
-
8
-
9
-
10
-
11
-
12
-
13
-
14
-
15
-
16
-
17
-
18
-
19
-
20
-
21
-
22
-
23
-
24
-
25
-
26
-
27
-
28
-
29
-
30
-
31
-
32
-
33
-
34
-
35
-
36
-
37
-
38
-
39
-
40
-
41
-
42
-
43
-
44
-
45
-
46
-
47
-
48
-
49
-
50
-
51
-
52
-
53
-
54
-
55
-
56
-
57
-
58
-
59
-
60
-
61
-
62
-
63
-
64
-
65
-
66
-
67
-
68
-
69
-
70
-
71
-
72
-
73
-
74
-
75
-
76
-
77
-
78
-
79
-
80
-
81
-
82
-
83
-
84
-
85
-
86
-
87
-
88
-
89
-
90
-
91
-
92
-
93
-
94
-
95
-
96
-
97
-
98
-
99
-
100
-
101
-
102
-
103
-
104
-
105
-
106
-
107
-
108
-
109
-
110
-
111
-
112
-
113
-
114
-
115
-
116
-
117
-
118
-
119
-
120
-
121
-
122
-
123
-
124
-
125
-
126
-
127
-
128
-
129
-
130
-
131
-
132
-
133
-
134
-
135
-
136
-
137
-
138
-
139
-
140
-
141
-
142
-
143
-
144
-
145
-
146
-
147
-
148
-
149
-
150
-
151
-
152
-
153
-
154
-
155
-
156
-
157
-
158
-
159
-
160
-
161
-
162
-
163
-
 164
164 -
 165
165 -
 166
166 -
 167
167 -
 168
168 -
 169
169 -
 170
170 -
 171
171 -
 172
172 -
 173
173 -
 174
174 -
 175
175 -
 176
176 -
 177
177 -
 178
178 -
 179
179 -
 180
180 -
 181
181 -
 182
182 -
 183
183 -
 184
184 -
185
-
186
-
187
-
188
-
189
-
190
-
191
-
192
-
193
-
194
-
195
-
196
-
197
-
198
-
199
-
200
-
201
-
202
-
203
-
204
-
205
-
206
-
207
-
208
-
209
-
210
-
211
-
212
-
213
-
214
-
215
-
216
-
217
-
218
-
219
-
220
-
221
-
222
-
223
-
224
-
225
-
226
-
227
-
228
-
229
-
230
-
231
-
232
-
233
-
234
-
235
-
236
-
237
-
238
-
239
-
240
-
241
-
242
-
243
-
244
-
245
-
246
-
247
-
248
-
249
-
250
-
251
-
252
-
253
-
254
-
255
-
256
-
257
-
258
-
259
-
260
-
261
-
262
-
263
-
264
-
265
-
266
-
267
-
268
-
269
-
270
-
271
-
272
 |
 |

168 www.allstate.com
premium deficiency reserve may be required if the remaining DAC balance is insufficient to absorb the deficiency. In
2015, 2014 and 2013, our reviews concluded that no premium deficiency adjustments were necessary, primarily due
to projected profit from traditional life insurance more than offsetting the projected losses in immediate annuities with
life contingencies.
DAC related to interest-sensitive life insurance and fixed annuities is amortized in proportion to the incidence of the
total present value of gross profits, which includes both actual historical gross profits (“AGP”) and estimated future gross
profits (“EGP”) expected to be earned over the estimated lives of the contracts. The amortization is net of interest on the
prior period DAC balance using rates established at the inception of the contracts. Actual amortization periods generally
range from 15-30 years; however, incorporating estimates of the rate of customer surrenders, partial withdrawals and
deaths generally results in the majority of the DAC being amortized during the surrender charge period, which is typically
10-20 years for interest-sensitive life and 5-10 years for fixed annuities. The cumulative DAC amortization is reestimated
and adjusted by a cumulative charge or credit to income when there is a difference between the incidence of actual
versus expected gross profits in a reporting period or when there is a change in total EGP.
AGP and EGP primarily consist of the following components: contract charges for the cost of insurance less mortality
costs and other benefits (benefit margin); investment income and realized capital gains and losses less interest credited
(investment margin); and surrender and other contract charges less maintenance expenses (expense margin). The
principal assumptions for determining the amount of EGP are persistency, mortality, expenses, investment returns,
including capital gains and losses on assets supporting contract liabilities, interest crediting rates to contractholders,
and the effects of any hedges, and these assumptions are reasonably likely to have the greatest impact on the amount of
DAC amortization. Changes in these assumptions can be offsetting and we are unable to reasonably predict their future
movements or offsetting impacts over time.
Each reporting period, DAC amortization is recognized in proportion to AGP for that period adjusted for interest on the
prior period DAC balance. This amortization process includes an assessment of AGP compared to EGP, the actual amount
of business remaining in force and realized capital gains and losses on investments supporting the product liability. The
impact of realized capital gains and losses on amortization of DAC depends upon which product liability is supported by
the assets that give rise to the gain or loss. If the AGP is greater than EGP in the period, but the total EGP is unchanged,
the amount of DAC amortization will generally increase, resulting in a current period decrease to earnings. The opposite
result generally occurs when the AGP is less than the EGP in the period, but the total EGP is unchanged. However, when
DAC amortization or a component of gross profits for a quarterly period is potentially negative (which would result in an
increase of the DAC balance) as a result of negative AGP, the specific facts and circumstances surrounding the potential
negative amortization are considered to determine whether it is appropriate for recognition in the consolidated financial
statements. Negative amortization is only recorded when the increased DAC balance is determined to be recoverable
based on facts and circumstances. For products whose supporting investments are exposed to capital losses in excess
of our expectations which may cause periodic AGP to become temporarily negative, EGP and AGP utilized in DAC
amortization may be modified to exclude the excess capital losses.
Annually, we review and update the assumptions underlying the projections of EGP, including persistency, mortality,
expenses, investment returns, comprising investment income and realized capital gains and losses, interest crediting
rates and the effect of any hedges, using our experience and industry experience. At each reporting period, we assess
whether any revisions to assumptions used to determine DAC amortization are required. These reviews and updates
may result in amortization acceleration or deceleration, which are referred to as “DAC unlocking”. If the update of
assumptions causes total EGP to increase, the rate of DAC amortization will generally decrease, resulting in a current
period increase to earnings. A decrease to earnings generally occurs when the assumption update causes the total EGP
to decrease.
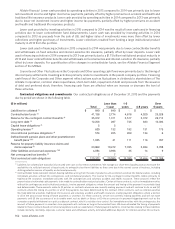
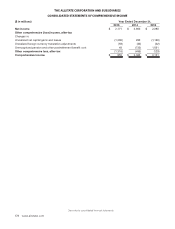
The following table provides the effect on DAC amortization of changes in assumptions relating to the gross profit
components of investment margin, benefit margin and expense margin during the years ended December 31.
($ in millions) 2015 2014 2013
Investment margin $ 2 $ 11 $ (17)
Benefit margin 1 35 15
Expense margin (2) (54) 25
Net acceleration (deceleration) $ 1 $ (8) $ 23