Zynga 2011 Annual Report Download - page 87
Download and view the complete annual report
Please find page 87 of the 2011 Zynga annual report below. You can navigate through the pages in the report by either clicking on the pages listed below, or by using the keyword search tool below to find specific information within the annual report.-
 1
1 -
2
-
3
-
4
-
5
-
6
-
7
-
8
-
9
-
10
-
11
-
12
-
13
-
14
-
15
-
16
-
17
-
18
-
19
-
20
-
21
-
22
-
23
-
24
-
25
-
26
-
27
-
28
-
29
-
30
-
31
-
32
-
33
-
34
-
35
-
36
-
37
-
38
-
39
-
40
-
41
-
42
-
43
-
44
-
45
-
46
-
47
-
48
-
49
-
50
-
51
-
52
-
53
-
54
-
55
-
56
-
57
-
58
-
59
-
60
-
61
-
62
-
63
-
64
-
65
-
66
-
67
-
68
-
69
-
70
-
71
-
72
-
73
-
74
-
75
-
76
-
 77
77 -
 78
78 -
 79
79 -
 80
80 -
 81
81 -
 82
82 -
 83
83 -
 84
84 -
 85
85 -
 86
86 -
 87
87 -
 88
88 -
 89
89 -
 90
90 -
 91
91 -
 92
92 -
 93
93 -
 94
94 -
 95
95 -
 96
96 -
 97
97 -
98
-
99
-
100
-
101
-
102
-
103
-
104
 |
 |

Table of Contents
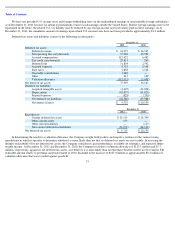
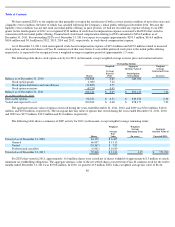
The following table sets forth the computation of basic and diluted net income (loss) per share of common stock (in thousands, except per
share data):
83
Year Ended December 31,
2011
2010
2009
Class
Class
Class
Class
Class
Class
Class
Class
Class
A
B
C
A
B
C
A
B
C
BASIC:
Net income (loss)
$
(8,522
)
$
(367,051
)
$
(28,743
)
$
—
$
82,293
$
8,302
$
—
$
(
46,512
)
$
(6,310
)
Deemed dividend to a Series B-2 convertible
preferred stockholder
—
—
—
—
(
4,169
)
(421
)
—
—
—
Net income attributable to participating
securities
—
—
—
—
(
52,785
)
(5,325
)
—
—
—
Net income (loss) attributable to common
stockholders
$
(8,522
)
$
(367,051
)
$
(28,743
)
$
—
$
25,339
$
2,556
$
—
$
(
46,512
)
$
(6,310
)
Weighted average common shares outstanding
6,083
261,999
20,517
—
203,364
20,517
—
151,234
20,517
Basic net income per share
$
(1.40
)
$
(1.40
)
$
(1.40
)
$
—
$
0.12
$
0.12
$
—
$
(
0.31
)
$
(0.31
)
DILUTED:
Net income (loss) attributable to common
stockholders
$
(8,522
)
$
(367,051
)
$
(28,743
)
$
—
$
25,339
$
2,556
$
—
$
(
46,512
)
$
(6,310
)
Reallocation of net income (loss) attributable
to participating securities
—
—
—
—
6,860
—
—
—
—
Reallocation of net income (loss) as a result of
conversion of Class C shares Class B to
Class B shares and Class A shares
$
(28,743
)
—
—
—
2,556
—
—
(
6,310
)
—
Reallocation of net income (loss) as a result of
conversion of Class B shares to Class A
shares
$
(367,051
)
—
—
—
—
—
—
—
—
Reallocation of net income (loss) to Class B
and Class C shares
—
—
—
—
—
(
390
)
—
—
—
Net income (loss) attributable to common
stockholders for diluted net income (loss)
per share
$
(404,316
)
$
(367,051
)
$
(28,743
)
$
—
$
34,755
$
2,166
$
—
$
(
52,822
)
$
(6,310
)
Number of shares used in basic computation
6,083
261,999
20,517
—
203,364
20,517
—
151,234
20,517
Conversion of Class C to Class B and Class A
common shares outstanding
20,517
—
20,517
—
—
20,517
—
Conversion of Class B to Class A common
shares outstanding
261,999
—
—
—
—
—
—
—
—
Weighted average effect of dilutive securities:
Employee stock options
—
—
—
—
94,301
—
—
—
—
Warrants
—
—
—
—
11,074
—
—
—
—
ZSUs
—
—
—
—
—
—
—
—
—
Number of shares used in diluted net income
(loss) per share
288,599
261,999
20,517
—
329,256
20,517
—
171,751
20,517
Diluted net income (loss) per share
$
(1.40
)
$
(1.40
)
$
(1.40
)
$
—
$
0.11
$
0.11
$
—
$
(
0.31
)
$
(0.31
)